Florida B.E.S.T. MA.7.AR.4.2
The Standard
Determine the constant of proportionality within a mathematical or real-world context given a table, graph or written description of a proportional relationship.
Florida B.E.S.T. Standards for Mathematics
Teacher's field guide
What This Standard Means
What Students Need to Do
- Students calculate y ÷ x from pairs in tables, graphs, or descriptions. They interpret the result as the amount of y for one unit of x.
What Mastery Looks Like
- Students correctly find the same value of y ÷ x for each pair and identify it on a graph. They state what the value means, including its units.
Common Misconceptions
- Students may divide in the wrong order, using x ÷ y instead of y ÷ x. They may confuse the constant with an additive change or assume any straight line is proportional.
How to Assess It
- Exit ticket: A faucet fills 18 gallons in 3 minutes at a constant rate. Find the constant of proportionality and explain its units.
Lesson moves
Ways to Teach It
Have students add equal scoops of rice to a container, record total volume, and calculate volume per scoop.
Ask students to explain why y ÷ x stays constant in a proportional relationship while y minus x usually does not.
Give pairs cards showing tables, graphs, descriptions, and constants, then have them match each complete set.
Compare grocery shelf labels by calculating price per ounce, then identify which product has the lower constant of proportionality.
Free download
Printable MA.7.AR.4.2 Worksheet
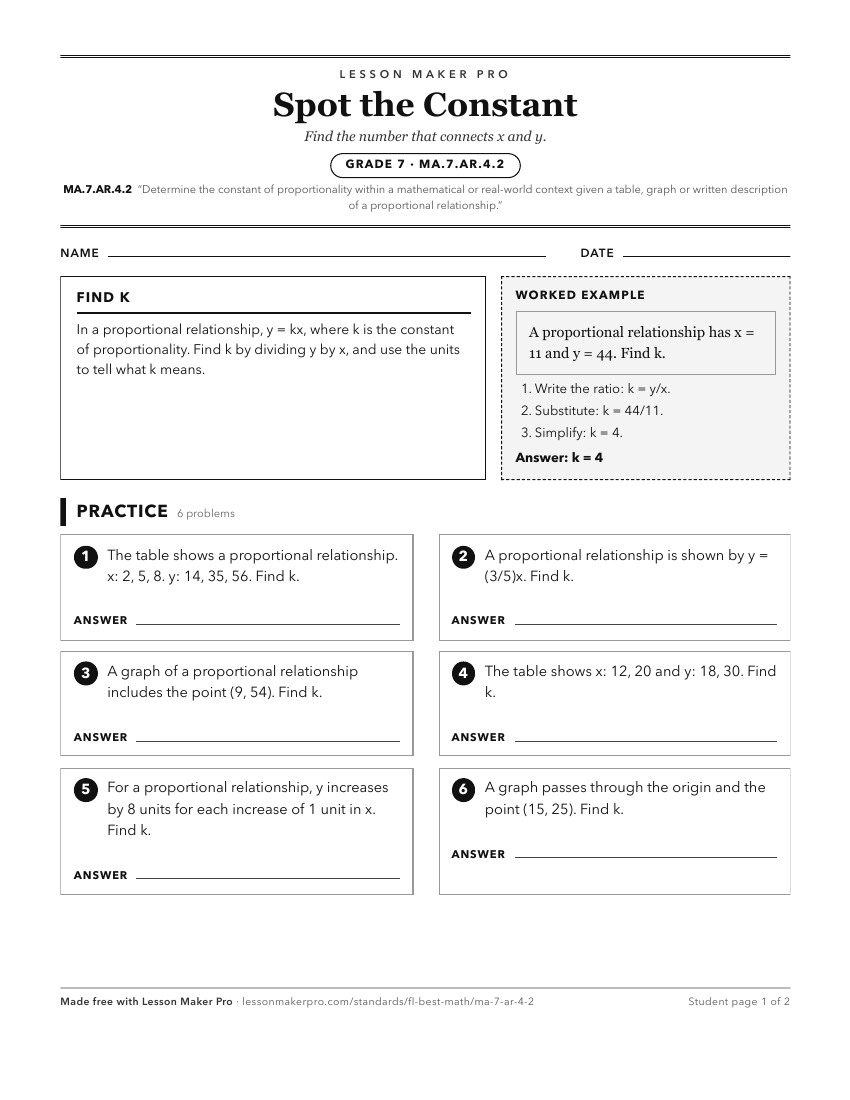
A ready-to-print activity worksheet aligned to MA.7.AR.4.2, with an answer key for the teacher on its own page. No account needed.
PDF, US Letter, prints cleanly in black and white.
Download the worksheetKeep exploring
Related Standards
- MA.7.AR.4.1
Determine whether two quantities have a proportional relationship by examining a table, graph or written description.
- MA.7.AR.4.4
Given any representation of a proportional relationship, translate the representation to a written description, table or equation.
- MA.8.AR.3.1
Determine if a linear relationship is also a proportional relationship.
- MA.7.AR.4.3
Given a mathematical or real-world context, graph proportional relationships from a table, equation or a written description.
Turn this exact standard into a lesson
Grade, subject, topic, and the complete standard are prefilled. Create one free, no account needed.
Also for this standard:Make a WorksheetMake a QuizMake a Sub Lesson