CCSS.
Standard Cluster
Represent and solve equations and inequalities graphically
Common Core State Standards for Mathematics · High School — Algebra
Cluster contents
Standards in This Cluster
CCSS.Math.Content.HSA-REI.D is a cluster heading. These are the individual standards under it.
- CCSS.Math.Content.HSA-REI.D.10
Understand that the graph of an equation in two variables is the set of all its solutions plotted in the coordinate plane, often forming a curve (which could be...
- CCSS.Math.Content.HSA-REI.D.11
Explain why the x-coordinates of the points where the graphs of the equations y = f(x) and y = g(x) intersect are the solutions of the equation f(x) = g(x); fin...
- CCSS.Math.Content.HSA-REI.D.12
Graph the solutions to a linear inequality in two variables as a half-plane (excluding the boundary in the case of a strict inequality), and graph the solution ...
Teacher's field guide
What This Cluster Means
What Students Need to Do
- Students graph both sides of an equation as separate functions and find where the graphs meet. For inequalities, they graph boundaries, test points, and identify shaded regions that satisfy all conditions.
What Mastery Looks Like
- Students choose a useful scale and graph each relation accurately. They identify intersection values, shade correct regions, use solid or dashed boundaries correctly, and check answers in the original relation.
Common Misconceptions
- Students may report the y-coordinate of an intersection instead of the x-coordinate that solves the equation. They may also use the wrong boundary line, shade the wrong side, or miss solutions because of a poor graphing window.
How to Assess It
- On one set of axes, graph y = x + 2 and y = x². Give both x-values where the graphs meet, then shade where x² > x + 2.
Lesson moves
Ways to Teach It
Graph y = x² and y = 2x + 3 on separate transparencies, overlay them, and mark the intersections.
Write why the x-coordinate of an intersection solves f(x) = g(x), while the y-coordinate does not.
Match cards showing equations, graphs, intersection points, and solution sets, then explain each match to a partner.
Graph a business's cost and revenue functions, then identify and interpret the break-even point.
Free download
Printable HSA-REI.D Worksheet
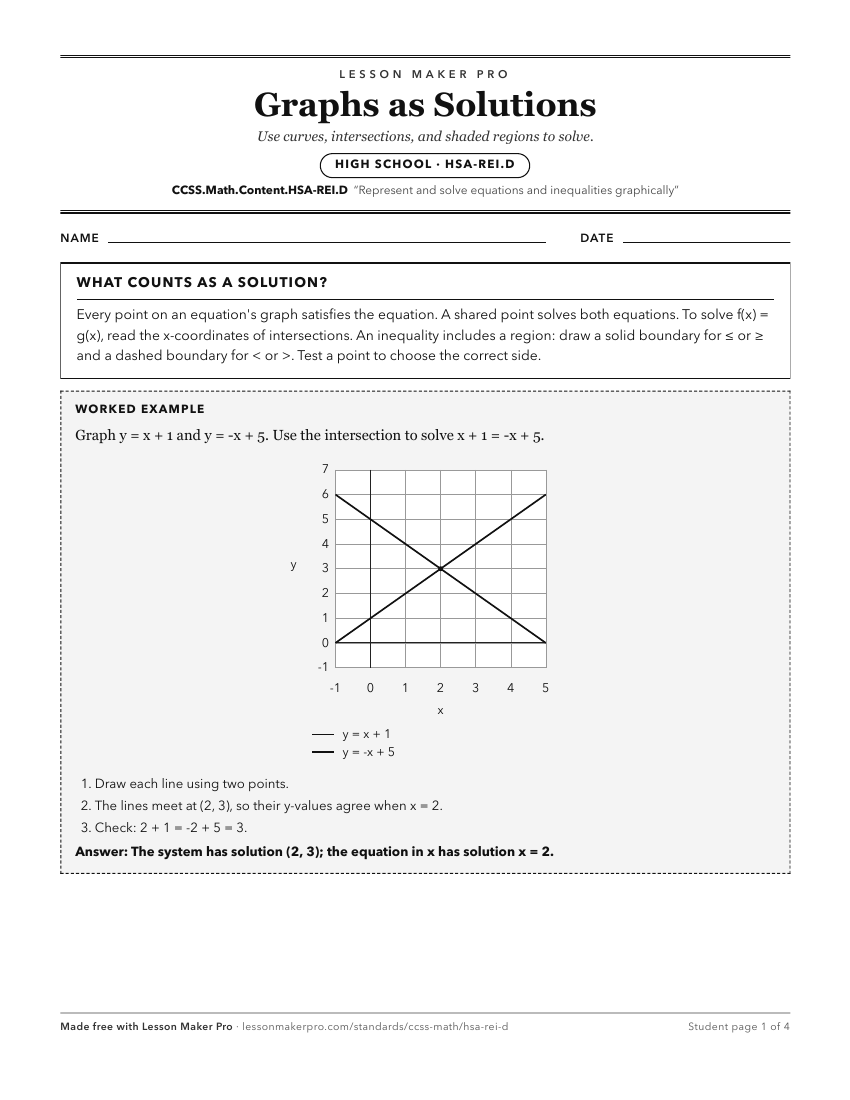
A ready-to-print activity worksheet aligned to CCSS.Math.Content.HSA-REI.D, with an answer key for the teacher on its own page. No account needed.
PDF, US Letter, prints cleanly in black and white.
Download the worksheetKeep exploring
Related Standards
- CCSS.Math.Content.HSA-REI.B
Solve equations and inequalities in one variable
- CCSS.Math.Content.2.OA.A
Represent and solve problems involving addition and subtraction.
- CCSS.Math.Content.1.OA.A
Represent and solve problems involving addition and subtraction.
- CCSS.Math.Content.6.EE.B
Reason about and solve one-variable equations and inequalities.
Turn this cluster into a lesson
Grade, subject, topic, and the complete cluster are prefilled. Create one free, no account needed.
Also for this cluster:Make a WorksheetMake a QuizMake a Sub Lesson