CCSS.
Standard Cluster
Investigate chance processes and develop, use, and evaluate probability models.
Common Core State Standards for Mathematics
Cluster contents
Standards in This Cluster
CCSS.Math.Content.7.SP.C is a cluster heading. These are the individual standards under it.
- CCSS.Math.Content.7.SP.C.5
Understand that the probability of a chance event is a number between 0 and 1 that expresses the likelihood of the event occurring. Larger numbers indicate grea...
- CCSS.Math.Content.7.SP.C.6
Approximate the probability of a chance event by collecting data on the chance process that produces it and observing its long-run relative frequency, and predi...
- CCSS.Math.Content.7.SP.C.7
Develop a probability model and use it to find probabilities of events. Compare probabilities from a model to observed frequencies; if the agreement is not good...
- CCSS.Math.Content.7.SP.C.7a
Develop a uniform probability model by assigning equal probability to all outcomes, and use the model to determine probabilities of events.
- CCSS.Math.Content.7.SP.C.7b
Develop a probability model (which may not be uniform) by observing frequencies in data generated from a chance process.
- CCSS.Math.Content.7.SP.C.8
Find probabilities of compound events using organized lists, tables, tree diagrams, and simulation.
- CCSS.Math.Content.7.SP.C.8a
Understand that, just as with simple events, the probability of a compound event is the fraction of outcomes in the sample space for which the compound event oc...
- CCSS.Math.Content.7.SP.C.8b
Represent sample spaces for compound events using methods such as organized lists, tables and tree diagrams. For an event described in everyday language (e.g., ...
- CCSS.Math.Content.7.SP.C.8c
Design and use a simulation to generate frequencies for compound events.
Teacher's field guide
What This Cluster Means
What Students Need to Do
- Students describe likelihood with a number from 0 to 1. They use lists, tables, tree diagrams, simulations, and calculations to find probabilities for simple and compound events. They compare predictions with repeated-trial data and judge whether a model fits.
What Mastery Looks Like
- A student assigns probabilities from 0 to 1, builds complete sample spaces, and calculates probabilities for simple and compound events. They use trials or simulations to estimate probabilities and explain differences between observed and predicted results. They can revise a model when data do not fit it.
Common Misconceptions
- Students may assume every outcome is equally likely, confuse an outcome with an event, or omit possibilities from a sample space. They may add probabilities when events must both happen, or expect a small trial to match predictions exactly. Some treat a probability of 0.7 as a guarantee that the event will happen next.
How to Assess It
- Ask: “For two fair number cubes, what is the probability that the sum is at least 10? Show a sample space and predict the successes in 72 rolls.” Then ask whether 15 successes would prove the model wrong.
Lesson moves
Ways to Teach It
Pairs roll two dice 60 times, record sums, and compare the observed frequency of 7 with the predicted probability of 6/36.
Given 50 draws with 32 reds, students write whether a bag model with 1/2 or 2/3 red marbles fits better and why.
Play probability match with event cards, sample spaces, fractions, and likelihood words, then have students defend each match to a partner.
Use a weather forecast showing a 40 percent rain chance to discuss what that number predicts across many similar days.
Free download
Printable 7.SP.C Worksheet
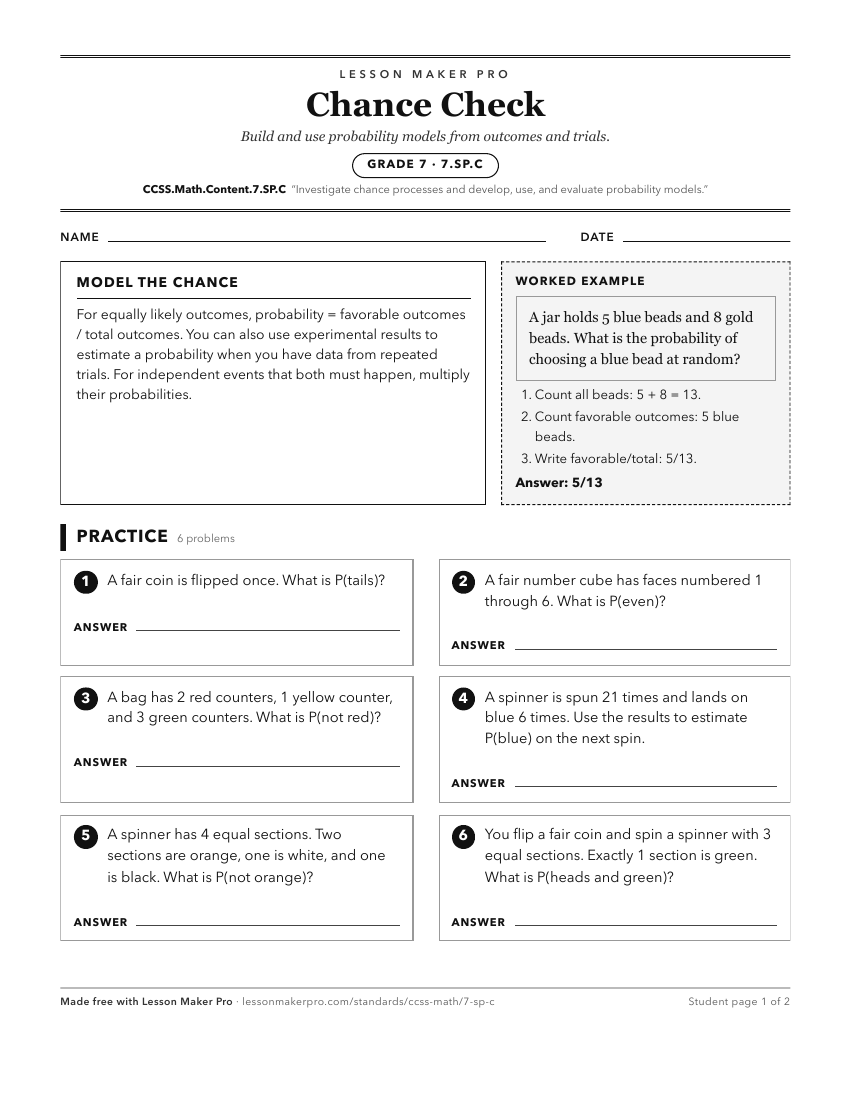
A ready-to-print activity worksheet aligned to CCSS.Math.Content.7.SP.C, with an answer key for the teacher on its own page. No account needed.
PDF, US Letter, prints cleanly in black and white.
Download the worksheetKeep exploring
Related Standards
Turn this cluster into a lesson
Grade, subject, topic, and the complete cluster are prefilled. Create one free, no account needed.
Also for this cluster:Make a WorksheetMake a QuizMake a Sub Lesson