Alabama Math PC.F.D.31.b
The Standard
- PC.F.D
- Build new functions from existing functions.
- PC.F.D.31
- Graph conic sections from second-degree equations, extending from circles and parabolas to ellipses and hyperbolas, using technology to discover patterns.
Identify the conic section that will be formed, given its equation in general form.
2019 Alabama Course of Study: Mathematics
Teacher's field guide
What This Standard Means
What Students Need to Do
- Students read a quadratic equation in x and y and identify the shape of its graph. They compare the coefficients of x², xy, and y², then check whether the equation has a real graph.
What Mastery Looks Like
- A student identifies 4x²+9y²=36 as an ellipse and x²−9y²=9 as a hyperbola without graphing. When an xy term appears, they use B²−4AC to help classify the graph.
Common Misconceptions
- Students may call any graph with two squared variables a circle, even when the coefficients differ. They may ignore an xy term or call an equation with only one squared variable an ellipse. Some call x²+y²+1=0 a circle, although it has no real points.
How to Assess It
- Exit ticket: Classify x²+3xy+y²=1. Show the coefficient check you used.
Lesson moves
Ways to Teach It
Cut out cards showing x²+y²=9, 4x²+y²=16, y²=4x, and x²−y²=9; have students sort them by graph shape.
Ask partners why 4x²+9y²=36 is an ellipse but 4x²−9y²=36 is a hyperbola.
Put five equations on the board; pairs race to label each graph and explain one answer using coefficients.
Shine a flashlight straight at a wall, then tilt it; match the round and oval patches to x²+y²=9 and 4x²+9y²=36.
Free download
Printable PC.F.D.31.b Worksheet
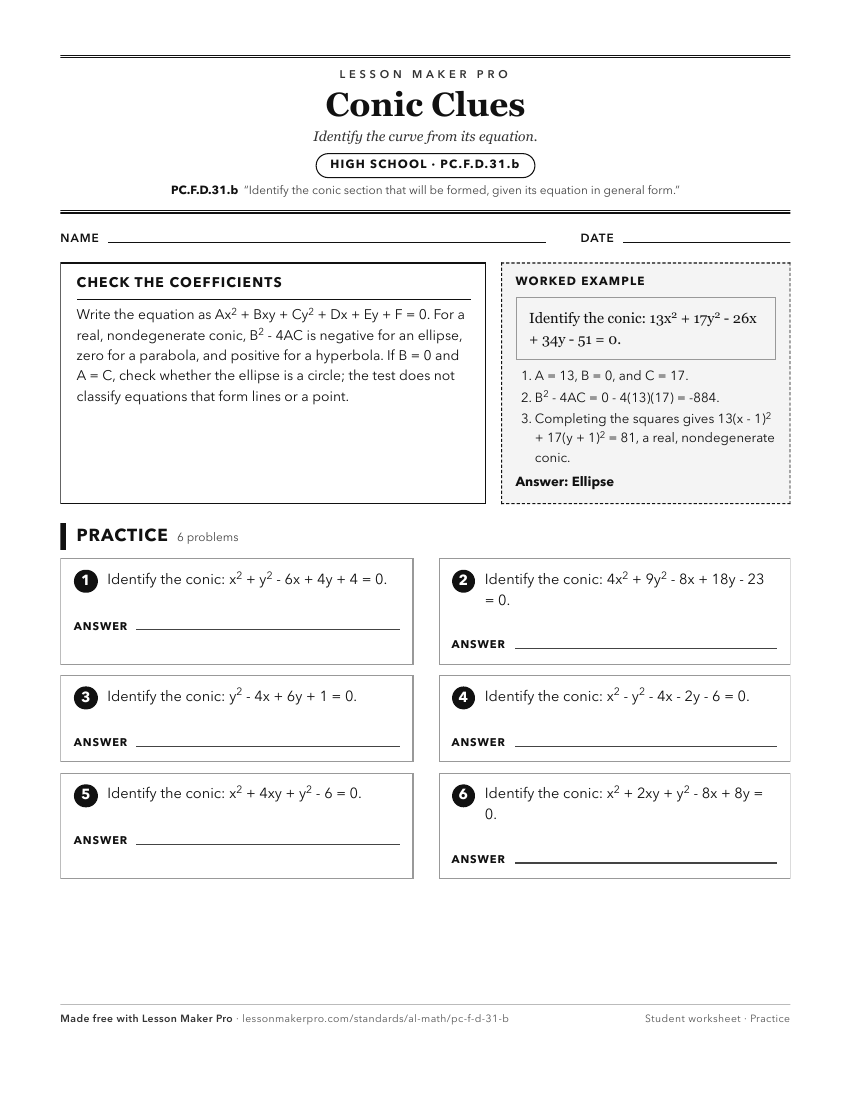
A ready-to-print activity worksheet aligned to PC.F.D.31.b, with an answer key for the teacher on its own page. No account needed.
PDF, US Letter, prints cleanly in black and white.
Download the worksheetKeep exploring
Related Standards
- PC.F.D.31.a
Graph conic sections given their standard form.
- PC.F.D.31
Graph conic sections from second-degree equations, extending from circles and parabolas to ellipses and hyperbolas, using technology to discover patterns.
- A1P.AF.E.14
Given a relation defined by an equation in two variables, identify the graph of the relation as the set of all its solutions plotted in the coordinate plane.
Turn this exact standard into a lesson
Grade, subject, topic, and the complete standard are prefilled. Create one free, no account needed.
Also for this standard:Make a WorksheetMake a QuizMake a Sub Lesson