Alabama Math PC.F.B.26
Standard Cluster
- PC.F.B
- Analyze functions using different representations.
Graph functions expressed symbolically and show key features of the graph, by hand and using technology. Use the equation of functions to identify key features in order to generate a graph. a. Graph rational functions, identifying zeros and asymptotes when suitable factorizations are available, and showing end behavior. b. Graph trigonometric functions and their inverses, showing period, midline, amplitude, and phase shift.
2019 Alabama Course of Study: Mathematics · Functions
Cluster contents
Standards in This Cluster
PC.F.B.26 is a cluster heading. These are the individual standards under it.
Teacher's field guide
What This Cluster Means
What Students Need to Do
- Students use factored rational equations to find zeros and asymptotes, then show end behavior. They label period, midline, amplitude, and shift on trig graphs. They sketch by hand, check with a graphing tool, and graph inverse trig functions using restricted domains.
What Mastery Looks Like
- For y=(x-2)/(x+1), they mark the zero at 2, the asymptotes x=-1 and y=1, and both ends approaching y=1. For y=2sin(x-π/2)+1, they label amplitude 2, period 2π, midline y=1, and a shift right π/2. They graph y=arcsin(x) with domain [-1,1] and range [-π/2,π/2].
Common Misconceptions
- Students may mark a canceled factor as a vertical asymptote instead of a hole. They may read a positive phase shift as a move left or confuse the midline with the amplitude. They may treat inverse sine as reciprocal sine.
How to Assess It
- Exit ticket: Sketch y=(x-2)/(x+1) and y=2sin(x-π/2)+1. Label the rational zero and asymptotes, plus the sine amplitude, period, midline, and shift.
Lesson moves
Ways to Teach It
Lay tape on graph paper at x=-1 and y=1, then plot points for y=(x-2)/(x+1) on both sides of x=-1.
Ask pairs: Why must sine be restricted to [-π/2, π/2] before we graph its inverse?
Play graph match with Desmos screenshots of y=2sin(x-π/2)+1, y=arcsin(x), and y=(x-2)/(x+1), paired with equation cards.
Give students a 24-hour tide chart; have them mark high and low tides, then write a sine model with a midline, amplitude, period, and shift.
Free download
Printable PC.F.B.26 Worksheet
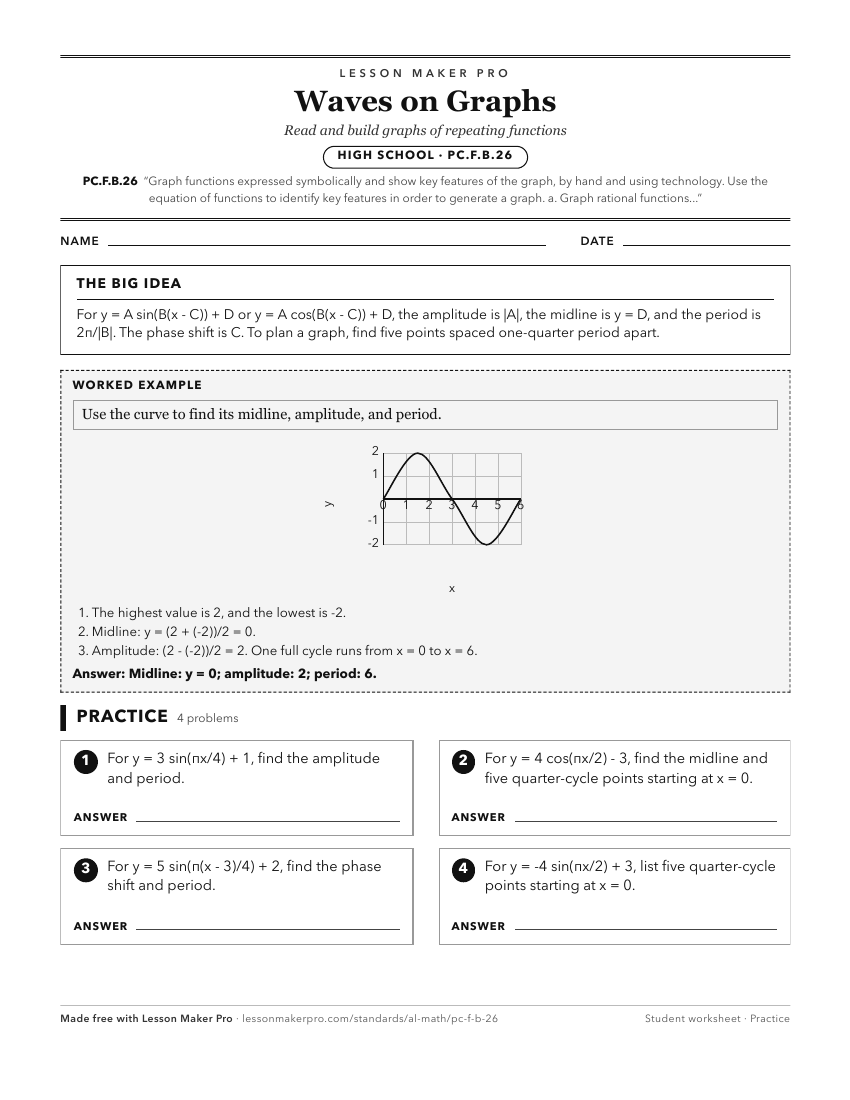
A ready-to-print activity worksheet aligned to PC.F.B.26, with an answer key for the teacher on its own page. No account needed.
PDF, US Letter, prints cleanly in black and white.
Download the worksheetKeep exploring
Related Standards
- A2S.AF.H.20
Graph functions expressed symbolically and show key features of the graph, by hand in simple cases and using technology for more complicated cases. Extend to po...
- A2S.AF.H
Functions can be represented graphically, and key features of the graphs, including zeros, intercepts, and, when relevant, rate of change and maximum/minimum va...
Turn this cluster into a lesson
Grade, subject, topic, and the complete cluster are prefilled. Create one free, no account needed.
Also for this cluster:Make a WorksheetMake a QuizMake a Sub Lesson