Alabama Math GDA.AF.C
Standard Cluster
Graphs can be used to obtain exact or approximate solutions of equations, inequalities, and systems of equations and inequalities—including systems of linear equations in two variables and systems of linear and quadratic equations (given or obtained by using technology).
2019 Alabama Course of Study: Mathematics · Geometry with Data Analysis
Cluster contents
Standards in This Cluster
GDA.AF.C is a cluster heading. These are the individual standards under it.
- GDA.AF.C.5
Verify that the graph of a linear equation in two variables is the set of all its solutions plotted in the coordinate plane, which forms a line.
- GDA.AF.C.6
Derive the equation of a circle of given center and radius using the Pythagorean Theorem.
- GDA.AF.C.6.a
Given the endpoints of the diameter of a circle, use the midpoint formula to find its center and then use the Pythagorean Theorem to find its equation.
- GDA.AF.C.6.b
Derive the distance formula from the Pythagorean Theorem.
Teacher's field guide
What This Cluster Means
What Students Need to Do
- Students graph lines and curves to find where they meet. They use the graph to find values that satisfy an inequality or a system of inequalities. They tell when a graph gives an exact value and when it gives an estimate.
What Mastery Looks Like
- A student marks the intersections of y=x² and y=x+2 as (-1,1) and (2,4). They give -1≤x≤2 for x²≤x+2. They shade only the shared region for y≥x+2 and y≤4.
Common Misconceptions
- Students may give only the x-coordinate for a system, though its solution is an ordered pair. They may shade the wrong side of a line or include a dashed boundary. They may treat a rounded value read from a graph as exact.
How to Assess It
- Exit ticket: Graph y=x² and y=x+2. Label both intersection points and write all x-values where x²≤x+2.
Lesson moves
Ways to Teach It
Graph and shade y≥x+1 and y≤-x+5 on separate tracing sheets, then stack the sheets to see the shared region.
Use a Desmos graph of y=x² and y=2 to explain why x≈1.41 is an estimate but x=√2 is exact.
Race to match graph cards for y=x² and y=x+2 with solution cards showing (-1,1), (2,4), and -1≤x≤2.
Plot phone plans costing $15 plus $5 per gigabyte and $30 plus $2 per gigabyte; find where costs match and which costs less.
Free download
Printable GDA.AF.C Worksheet
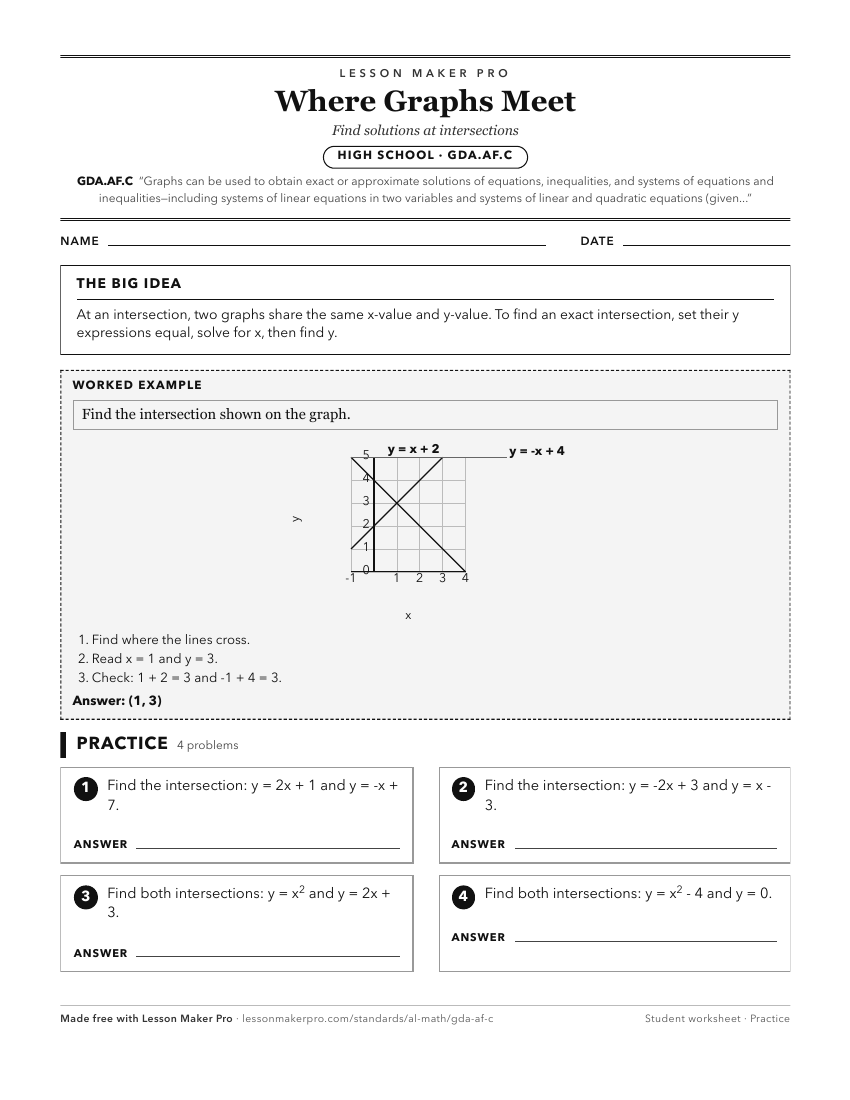
A ready-to-print activity worksheet aligned to GDA.AF.C, with an answer key for the teacher on its own page. No account needed.
PDF, US Letter, prints cleanly in black and white.
Download the worksheetKeep exploring
Related Standards
- A2S.AF.E
Graphs can be used to obtain exact or approximate solutions of equations, inequalities, and systems of equations and inequalities—including systems of linear eq...
- 8A.AF.G
Graphs can be used to obtain exact or approximate solutions of equations, inequalities, and systems of equations and inequalities – including systems of linear ...
- A1P.AF.F
Graphs can be used to obtain exact or approximate solutions of equations, inequalities, and systems of equations and inequalities – including systems of linear ...
- 8A.AF.G.22
Solve systems consisting of linear and/or quadratic equations in two variables graphically, using technology where appropriate.
Turn this cluster into a lesson
Grade, subject, topic, and the complete cluster are prefilled. Create one free, no account needed.
Also for this cluster:Make a WorksheetMake a QuizMake a Sub Lesson