Alabama Math A2S.DSP.I.33
The Standard
- A2S.DSP.I
- The sampling distribution of a sample statistic formed from repeated samples for a given sample size drawn from a population can be used to identify typical behavior for that statistic. Examining several such sampling distributions leads to estimating a set of plausible values for the population parameter, using the margin of error as a measure that describes the sampling variability.
Use data from a randomized experiment to compare two treatments; limit to informal use of simulations to decide if an observed difference in the responses of the two treatment groups is unlikely to have occurred due to randomization alone, thus implying that the difference between the treatment groups is meaningful.
2019 Alabama Course of Study: Mathematics · The sampling distribution of a sample statistic formed from repeated samples for a given sample size drawn from a population can be used to identify typical behavior for that statistic. Examining several such sampling distributions leads to estimating a set of plausible values for the population parameter, using the margin of error as a measure that describes the sampling variability.
Teacher's field guide
What This Standard Means
What Students Need to Do
- Students compare the results of two treatments given to randomly assigned groups. They shuffle treatment labels to see how often chance produces a gap as large as the one observed. They decide whether random assignment alone seems to explain the gap.
What Mastery Looks Like
- A student finds the difference between group means or approval rates. They keep group sizes fixed when shuffling labels. If few shuffled gaps are as large as the observed gap, they describe it as evidence that the treatment mattered, not proof.
Common Misconceptions
- Students may call any gap proof that a treatment worked. Others shuffle results only within each group or change the group sizes, so their simulation does not test chance assignment. Some think a rare shuffled gap means chance is impossible.
How to Assess It
- Exit ticket: Randomly assigned groups A and B got 3 of 4 and 1 of 4 thumbs-up votes; 2 of 20 label shuffles gave a gap this large or larger. Explain whether random assignment alone convincingly explains the gap.
Lesson moves
Ways to Teach It
Randomly assign eight students to fold dart or glider paper planes, measure flight distances, then shuffle distances into groups of four.
Ask: If only one of 20 shuffles matches the observed flight-distance gap, is chance assignment a good explanation? Why?
Give pairs eight flight-distance cards; deal four per group 20 times and tally mean gaps at least as large as the observed gap.
Post recipe A's ratings (yes, yes, yes, no) and B's (yes, no, no, no) from a randomized cafeteria taste test; shuffle recipe labels.
Free download
Printable A2S.DSP.I.33 Worksheet
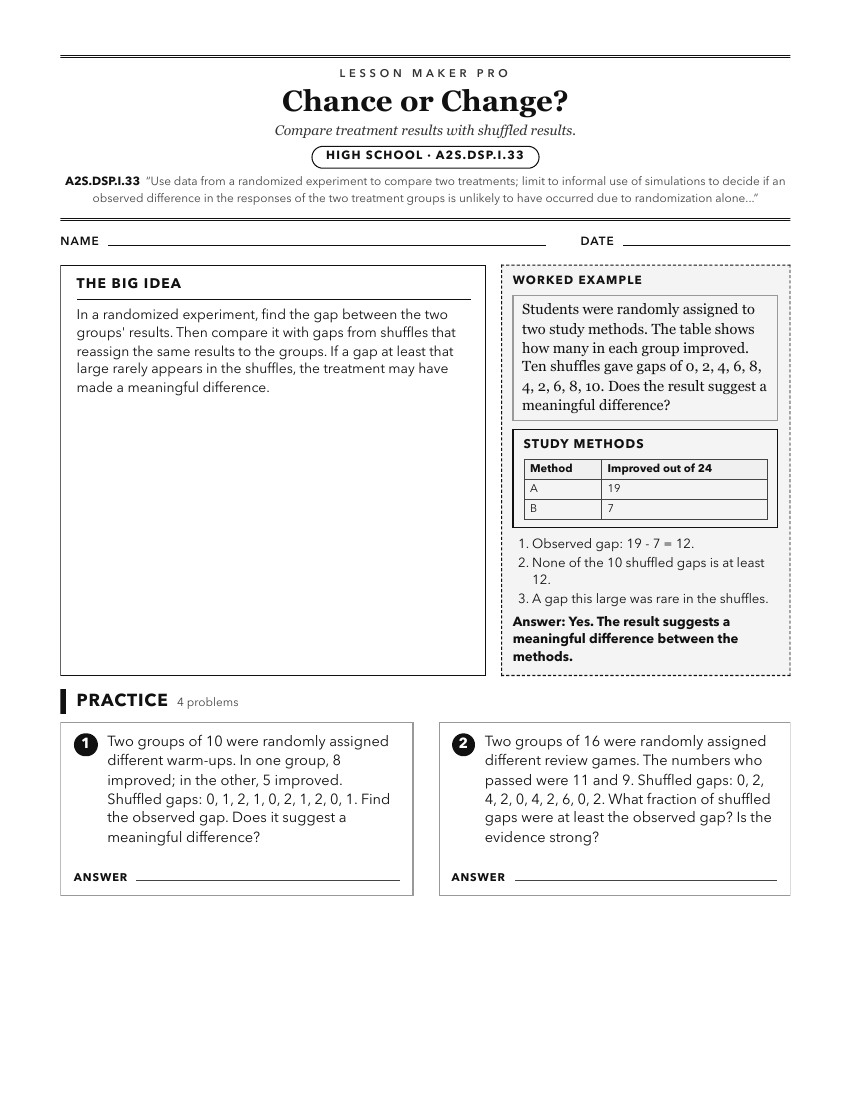
A ready-to-print activity worksheet aligned to A2S.DSP.I.33, with an answer key for the teacher on its own page. No account needed.
PDF, US Letter, prints cleanly in black and white.
Download the worksheetKeep exploring
Related Standards
- A2S.DSP.E.28
Describe differences between randomly selecting samples and randomly assigning subjects to experimental treatment groups in terms of inferences drawn regarding ...
- 7.DSP.C.15
Approximate the probability of an event using data generated by a simulation (experimental probability) and compare it to the theoretical probability.
- 7A.DSP.C.31
Approximate the probability of an event by using data generated by a simulation (experimental probability) and compare it to theoretical probability.
Turn this exact standard into a lesson
Grade, subject, topic, and the complete standard are prefilled. Create one free, no account needed.
Also for this standard:Make a WorksheetMake a QuizMake a Sub Lesson