Alabama Math A2S.DSP.H.31.a
The Standard
- A2S.DSP.H
- The larger the sample size, the less the expected variability in the sampling distribution of a sample statistic.
- A2S.DSP.H.31
- Evaluate the effect of sample size on the expected variability in the sampling distribution of a sample statistic.
Simulate a sampling distribution of sample means from a population with a known distribution, observing the effect of the sample size on the variability.
2019 Alabama Course of Study: Mathematics · The larger the sample size, the less the expected variability in the sampling distribution of a sample statistic.
Teacher's field guide
What This Standard Means
What Students Need to Do
- Students repeatedly draw random samples of two sizes from one known population and find each sample mean. They plot the means and compare how spread out the two groups are.
What Mastery Looks Like
- A student can make separate dot plots of means from 2-roll and 10-roll die samples. They see that the 10-roll means usually have less spread, while both sets center near 3.5.
Common Misconceptions
- Students may confuse the spread of individual rolls with the spread of sample means. They may think every larger sample must land closer to 3.5, or that sample size changes the population mean.
How to Assess It
- Exit ticket: Give students these die-roll sample means: size 2: 1.5, 2.5, 3.5, 4.5, 5.5; size 10: 2.9, 3.2, 3.5, 3.8, 4.1. Ask them to plot both sets and explain which has less spread.
Lesson moves
Ways to Teach It
Roll a die to make ten 2-roll samples and ten 10-roll samples; calculate each mean and plot both sets on separate number lines.
Show the class's two dot plots and ask, “Why do the means from 10 rolls bunch closer to 3.5?”
Play “Guess the Size”: show dot plots of precomputed die sample means and have teams vote for size 2 or 10, with a reason.
Compare spreads of mean weights for ten 2-apple and ten 8-apple bags using weight cards labeled 150, 160, 170, 180, 190 grams, with replacement.
Free download
Printable A2S.DSP.H.31.a Worksheet
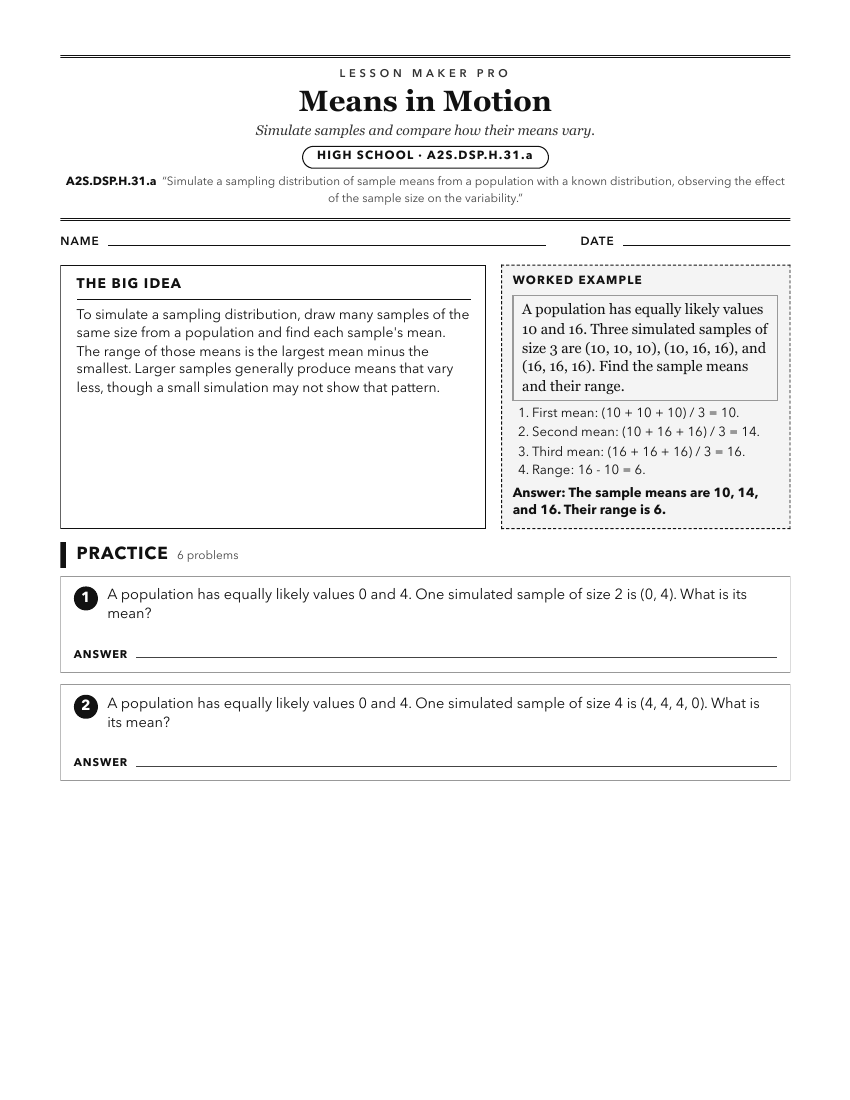
A ready-to-print activity worksheet aligned to A2S.DSP.H.31.a, with an answer key for the teacher on its own page. No account needed.
PDF, US Letter, prints cleanly in black and white.
Download the worksheetKeep exploring
Related Standards
- A2S.DSP.H.31
Evaluate the effect of sample size on the expected variability in the sampling distribution of a sample statistic.
- A2S.DSP.H.31.b
Demonstrate that the standard deviation of each simulated sampling distribution is the known standard deviation of the population divided by the square root of ...
- A2S.DSP.H
The larger the sample size, the less the expected variability in the sampling distribution of a sample statistic.
- A2S.DSP.I
The sampling distribution of a sample statistic formed from repeated samples for a given sample size drawn from a population can be used to identify typical beh...
Turn this exact standard into a lesson
Grade, subject, topic, and the complete standard are prefilled. Create one free, no account needed.
Also for this standard:Make a WorksheetMake a QuizMake a Sub Lesson