Alabama Math A2S.AF.H.20.c
The Standard
- A2S.AF.H
- Functions can be represented graphically, and key features of the graphs, including zeros, intercepts, and, when relevant, rate of change and maximum/minimum values, can be associated with and interpreted in terms of the equivalent symbolic representation.
- A2S.AF.H.20
- Graph functions expressed symbolically and show key features of the graph, by hand in simple cases and using technology for more complicated cases. Extend to polynomial, trigonometric (sine and cosine), logarithmic, reciprocal, radical, and general piecewise functions.
Graph logarithmic functions expressed symbolically, showing intercepts and end behavior.
2019 Alabama Course of Study: Mathematics · Functions can be represented graphically, and key features of the graphs, including zeros, intercepts, and, when relevant, rate of change and maximum/minimum values, can be associated with and interpreted in terms of the equivalent symbolic representation.
Teacher's field guide
What This Standard Means
What Students Need to Do
- Students graph a logarithmic equation by finding its domain, intercepts, and vertical asymptote. They describe what the graph does near the asymptote and as x gets large.
What Mastery Looks Like
- For y = log₂(x + 1) + 1, a student marks (−0.5, 0) and (0, 1), then draws the curve to the right of x = −1. They explain that the graph falls without bound near x = −1 and rises as x grows.
Common Misconceptions
- Students set the log's input to zero to find an intercept, but the log is undefined there. They may place the asymptote at x = 1 instead of x = −1. Some assume every logarithmic graph rises, even when its base is between 0 and 1.
How to Assess It
- On graph paper, sketch y = log₂(x + 1) + 1 and label both intercepts and the vertical asymptote. Write what happens as x approaches −1 from the right and as x grows.
Lesson moves
Ways to Teach It
Give students graph paper and the points (−0.75, −1), (−0.5, 0), (0, 1), and (1, 2); have them plot and connect the points.
Ask students to compare y = log₂(x) and y = log₂(x + 1) + 1 in writing, naming how the asymptote and intercepts change.
Make cards with three logarithmic equations and their graphs; have pairs match them and justify each match using an intercept and asymptote.
Give students L = 10 log₁₀(r) for a sound intensity ratio r; have them graph it and mark where L = 0.
Free download
Printable A2S.AF.H.20.c Worksheet
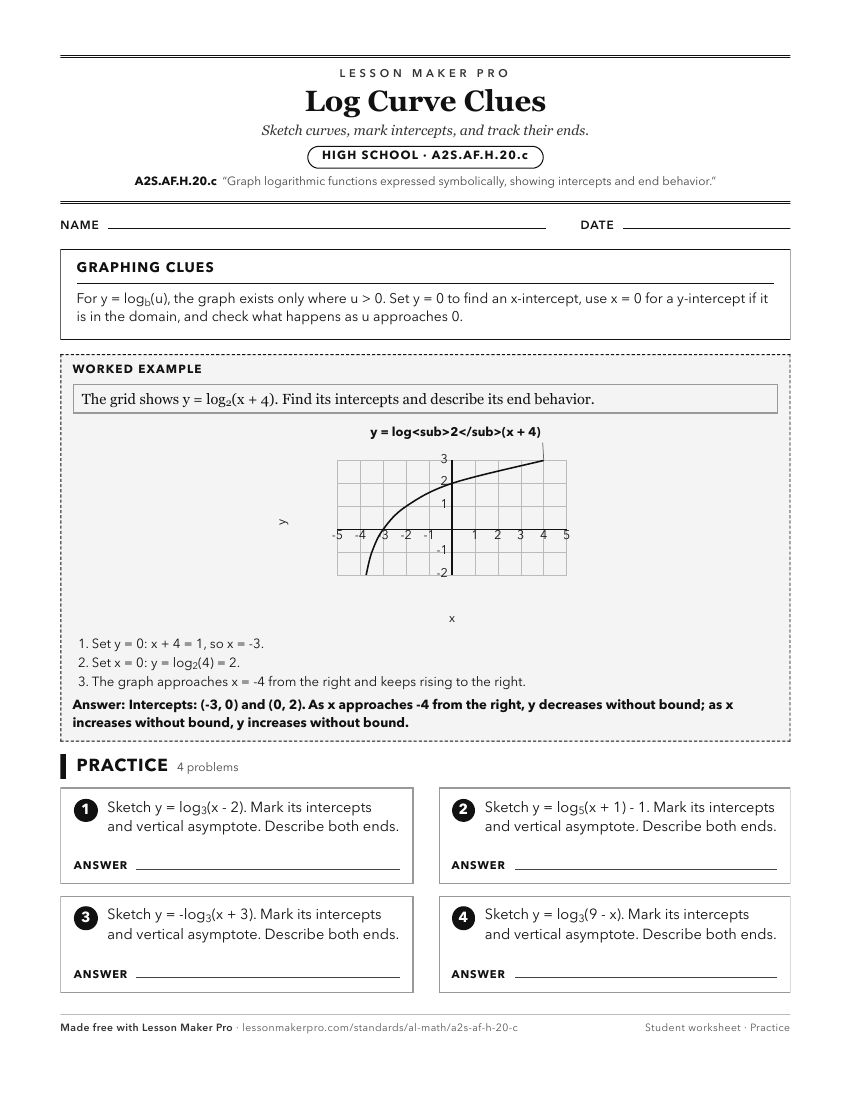
A ready-to-print activity worksheet aligned to A2S.AF.H.20.c, with an answer key for the teacher on its own page. No account needed.
PDF, US Letter, prints cleanly in black and white.
Download the worksheetKeep exploring
Related Standards
Turn this exact standard into a lesson
Grade, subject, topic, and the complete standard are prefilled. Create one free, no account needed.
Also for this standard:Make a WorksheetMake a QuizMake a Sub Lesson