Alabama Math A2S.AF.H.20.b
The Standard
- A2S.AF.H
- Functions can be represented graphically, and key features of the graphs, including zeros, intercepts, and, when relevant, rate of change and maximum/minimum values, can be associated with and interpreted in terms of the equivalent symbolic representation.
- A2S.AF.H.20
- Graph functions expressed symbolically and show key features of the graph, by hand in simple cases and using technology for more complicated cases. Extend to polynomial, trigonometric (sine and cosine), logarithmic, reciprocal, radical, and general piecewise functions.
Graph sine and cosine functions expressed symbolically, showing period, midline, and amplitude.
2019 Alabama Course of Study: Mathematics · Functions can be represented graphically, and key features of the graphs, including zeros, intercepts, and, when relevant, rate of change and maximum/minimum values, can be associated with and interpreted in terms of the equivalent symbolic representation.
Teacher's field guide
What This Standard Means
What Students Need to Do
- Students use an equation to find the wave’s midline, amplitude, and cycle length. They plot points every quarter-cycle and draw a smooth curve through them.
What Mastery Looks Like
- For y = -2cos(πx) + 1, a student marks a midline of 1, an amplitude of 2, and a cycle length of 2. Their graph starts at -1, reaches 3 halfway through, and returns to -1.
Common Misconceptions
- Students may call the amplitude negative when the wave is flipped. They may use the coefficient of x as the period or leave the midline at y = 0 after a vertical shift.
How to Assess It
- Ask students to sketch one cycle of y = 2cos(πx/2) - 1 and label its midline, amplitude, period, highest point, and lowest point.
Lesson moves
Ways to Teach It
Give pairs a blank grid and colored pencils; have them mark the midline and four quarter-cycle steps for y = -2cos(πx) + 1.
Ask: Why do y = 2sin(x) + 1 and y = sin(2x) + 1 make different waves? Have students cite amplitudes and periods.
Make equation and graph cards for four sine and cosine curves; students match pairs and check each match by labeling midline, amplitude, and period.
Plot y = 3cos(πt/6) + 5 as a tide model; ask students to mark high and low water and hours between high tides.
Free download
Printable A2S.AF.H.20.b Worksheet
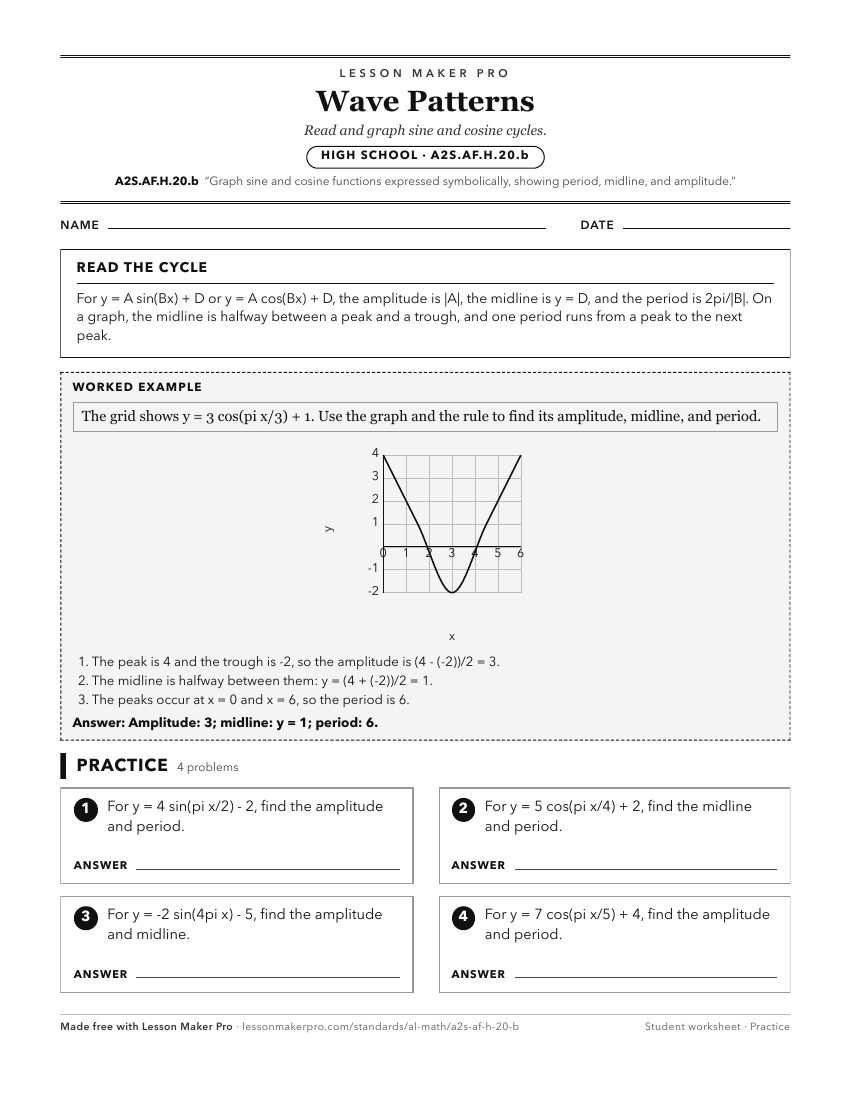
A ready-to-print activity worksheet aligned to A2S.AF.H.20.b, with an answer key for the teacher on its own page. No account needed.
PDF, US Letter, prints cleanly in black and white.
Download the worksheetKeep exploring
Related Standards
Turn this exact standard into a lesson
Grade, subject, topic, and the complete standard are prefilled. Create one free, no account needed.
Also for this standard:Make a WorksheetMake a QuizMake a Sub Lesson