Alabama Math A2S.AF.E.14
Standard Cluster
- A2S.AF.E
- Graphs can be used to obtain exact or approximate solutions of equations, inequalities, and systems of equations and inequalities—including systems of linear equations in two variables and systems of linear and quadratic equations (given or obtained by using technology).
Explain why the x-coordinates of the points where the graphs of the equations y = f(x) and y = g(x) intersect are the solutions of the equation f(x) = g(x). a. Find the approximate solutions of an equation graphically, using tables of values, or finding successive approximations, using technology where appropriate. Extend to cases where f(x) and/or g(x) are polynomial, trigonometric (sine and cosine), logarithmic, radical, and general piecewise functions.
2019 Alabama Course of Study: Mathematics
Cluster contents
Standards in This Cluster
A2S.AF.E.14 is a cluster heading. These are the individual standards under it.
Teacher's field guide
What This Cluster Means
What Students Need to Do
- Students explain that where two graphs meet, both functions give the same y-value for the same x-value. They estimate those x-values from graphs, tables, or repeated approximations, including for sine, logarithmic, square-root, and piecewise functions.
What Mastery Looks Like
- A student reports the x-value at each crossing or touch point and checks that both functions give the same y-value there. They refine an estimate with a table and rule out x-values outside either function's domain.
Common Misconceptions
- Students may give the intersection's y-value instead of its x-value. They may miss a point where the graphs only touch, or accept an x-value where a logarithm or square root is undefined.
How to Assess It
- Exit ticket: Plot y = x² and y = 2x + 1 on a graphing tool. Estimate both solution x-values to the nearest tenth and explain why they solve x² = 2x + 1.
Lesson moves
Ways to Teach It
Plot y = x² and y = 2x + 1 on graph paper, lay colored string along each graph, and mark both intersections.
Ask students why the x-value of an intersection solves f(x) = g(x), while its y-value does not.
In pairs, use a radian-mode table to narrow where y = sin(x) meets y = 0.5 between x = 0 and 1.
Graph taxi fares of $4 plus $2 per mile and $8 plus $1 per mile, then find the equal-cost distance.
Free download
Printable A2S.AF.E.14 Worksheet
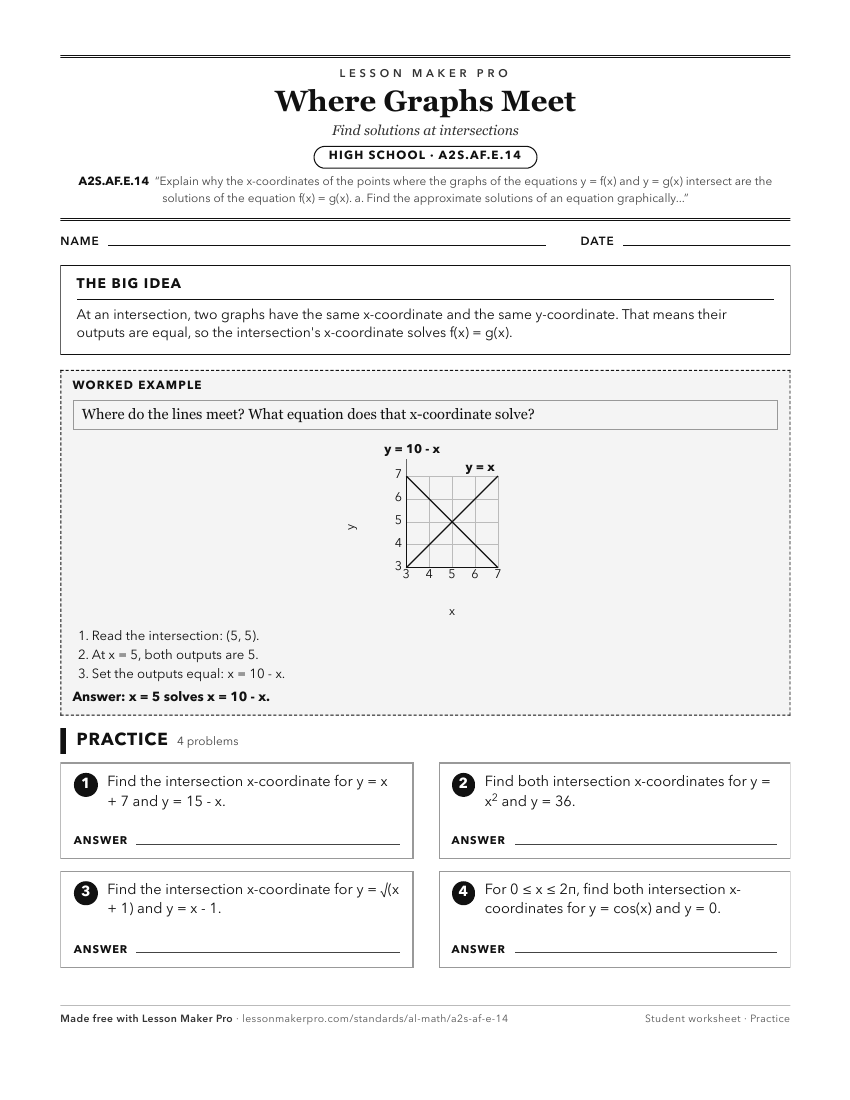
A ready-to-print activity worksheet aligned to A2S.AF.E.14, with an answer key for the teacher on its own page. No account needed.
PDF, US Letter, prints cleanly in black and white.
Download the worksheetKeep exploring
Related Standards
- 8A.AF.G.20
Explain why the x-coordinates of the points where the graphs of the equations y = f(x) and y = g(x) intersect are the solutions of the equation f(x) = g(x).
- A1P.AF.F.19
Explain why the x-coordinates of the points where the graphs of the equations y = f(x) and y = g(x) intersect are the solutions of the equation f(x) = g(x).
- 7A.AF.D.24
Explain why the x-coordinates of the points where the graphs of the equations y = f(x) and y = g(x) intersect are the solutions of the equation f(x) = g(x). Lim...
Turn this cluster into a lesson
Grade, subject, topic, and the complete cluster are prefilled. Create one free, no account needed.
Also for this cluster:Make a WorksheetMake a QuizMake a Sub Lesson