Alabama Math A2S.AF.D.13
The Standard
- A2S.AF.D
- Expressions, equations, and inequalities can be used to analyze and make predictions, both within mathematics and as mathematics is applied in different contexts—in particular, contexts that arise in relation to linear, quadratic, and exponential situations.
Create equations in two or more variables to represent relationships between quantities; graph equations on coordinate axes with labels and scales and use them to make predictions. Extend to polynomial, trigonometric (sine and cosine), logarithmic, reciprocal, radical, and general piecewise functions.
2019 Alabama Course of Study: Mathematics
Teacher's field guide
What This Standard Means
What Students Need to Do
- Students write equations that link two quantities, such as time and height or data use and cost. They graph polynomial, sine or cosine, logarithmic, reciprocal, radical, and piecewise relationships with labeled axes and useful scales. They use the graphs to predict values where the model makes sense.
What Mastery Looks Like
- A student can write a cosine model for repeating tide heights, label time and height on a graph, and predict the next high tide. They can also graph a phone bill with two pricing rules and estimate the cost at 8 GB.
Common Misconceptions
- Students may keep using the first phone rate after the price changes or plot y=log(x) at x=0. They may draw y=√x for negative x or use uneven number steps on an axis. They may trust a prediction far beyond the data used to build the model.
How to Assess It
- Exit ticket: A plan costs $20 plus $5 per GB for the first 5 GB, then $2 per extra GB. Write a cost rule, graph 0 to 10 GB with labeled axes and scales, and predict the cost at 8 GB.
Lesson moves
Ways to Teach It
Plot h(t)=3+2cos(πt/6) on graph paper at hours 0, 3, 6, 9, and 12; label hours and meters, then predict hour 15.
Ask students to compare y=x² and y=log₂(x) at x=4, then write why the logarithm graph cannot include x=0.
Play graph match with cards showing y=1/x, y=√x, and their graphs; partners label axes and predict both values at x=4.
Give a phone-plan sheet: $20 base, $5 per GB through 5 GB, then $2 per extra GB; write, graph, and predict the 8 GB bill.
Free download
Printable A2S.AF.D.13 Worksheet
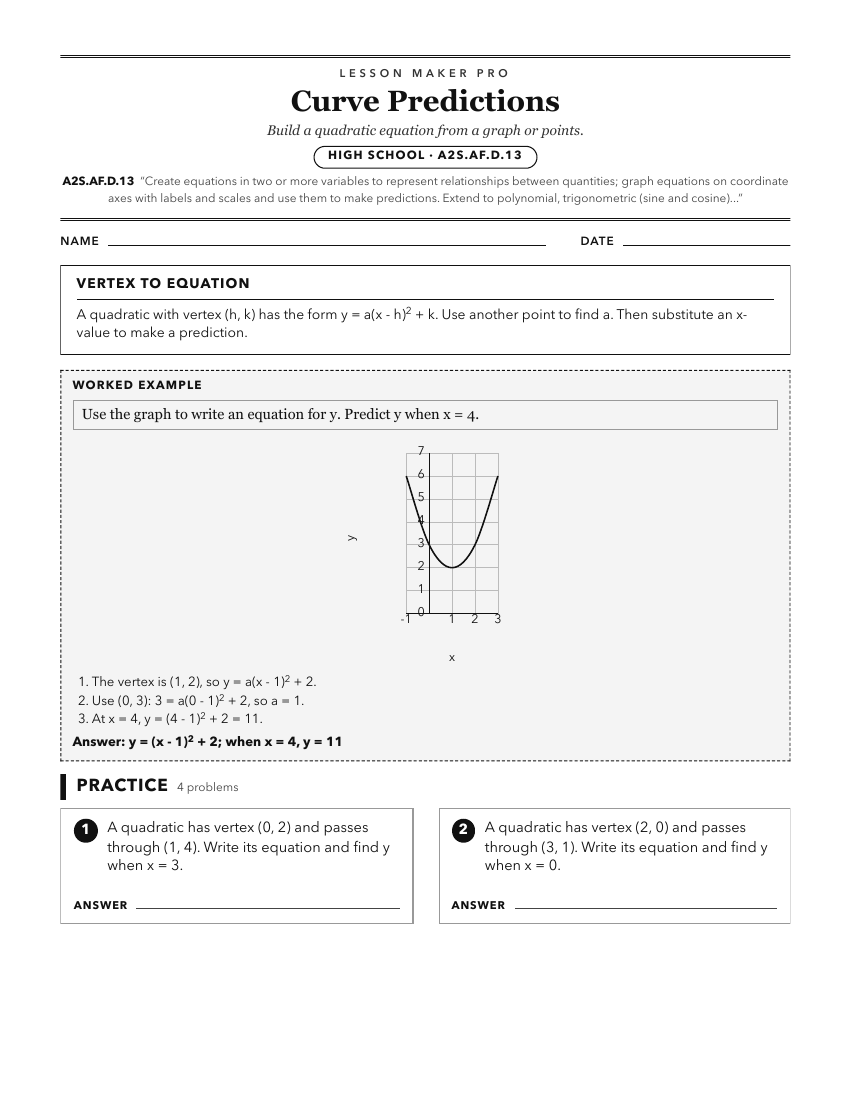
A ready-to-print activity worksheet aligned to A2S.AF.D.13, with an answer key for the teacher on its own page. No account needed.
PDF, US Letter, prints cleanly in black and white.
Download the worksheetKeep exploring
Related Standards
- A1P.AF.D.12
Create equations in two or more variables to represent relationships between quantities in context; graph equations on coordinate axes with labels and scales an...
- 8A.AF.E.14
Create equations in two or more variables to represent relationships between quantities in context; graph equations on coordinate axes with labels and scales an...
- 7A.AF.C.19
Create equations in two variables to represent relationships between quantities in context; graph equations on coordinate axes with labels and scales and use th...
- A2S.AF.D.10
Create equations and inequalities in one variable and use them to solve problems. Extend to equations arising from polynomial, trigonometric (sine and cosine), ...
Turn this exact standard into a lesson
Grade, subject, topic, and the complete standard are prefilled. Create one free, no account needed.
Also for this standard:Make a WorksheetMake a QuizMake a Sub Lesson