Alabama Math A1P.DSP.B.33
The Standard
- A1P.DSP.B
- Making and defending informed, data-based decisions is a characteristic of a quantitatively literate person.
Design and carry out an investigation to determine whether there appears to be an association between two categorical variables, and write a persuasive argument based on the results of the investigation.
2019 Alabama Course of Study: Mathematics
Teacher's field guide
What This Standard Means
What Students Need to Do
- Choose two questions with category answers and collect responses from the same people. Put the counts in a two-way table and compare percentages within groups. Write a claim about whether the variables appear to be associated, using the numbers and naming a limit of the sample.
What Mastery Looks Like
- A student finds the percent of bus riders who pack lunch and the percent of walkers who pack lunch, using each group's total. They use the difference to support a claim without saying that travel mode causes lunch choices.
Common Misconceptions
- Students compare raw counts even when the groups differ in size, or divide by the total number surveyed instead of each group's total. They may treat a small difference as proof of an association or assume one variable causes the other.
How to Assess It
- Exit ticket: Of 20 bus riders, 12 pack lunch; of 10 walkers, 3 pack lunch. Find both group percentages and write two sentences about whether the results suggest an association.
Lesson moves
Ways to Teach It
Give pairs 30 survey slips showing travel mode and packed lunch; have them sort the slips, build a two-way table, and compare group percentages.
Ask, 'Do bus riders pack lunch more often than walkers?' Have students write a claim with two percentages and one limit of the sample.
Put four two-way tables on cards; teams match each table to its correct group percentages and association claim.
Draft a note to the principal using the class travel and lunch survey, stating what the percentages show and why the sample may mislead.
Free download
Printable A1P.DSP.B.33 Worksheet
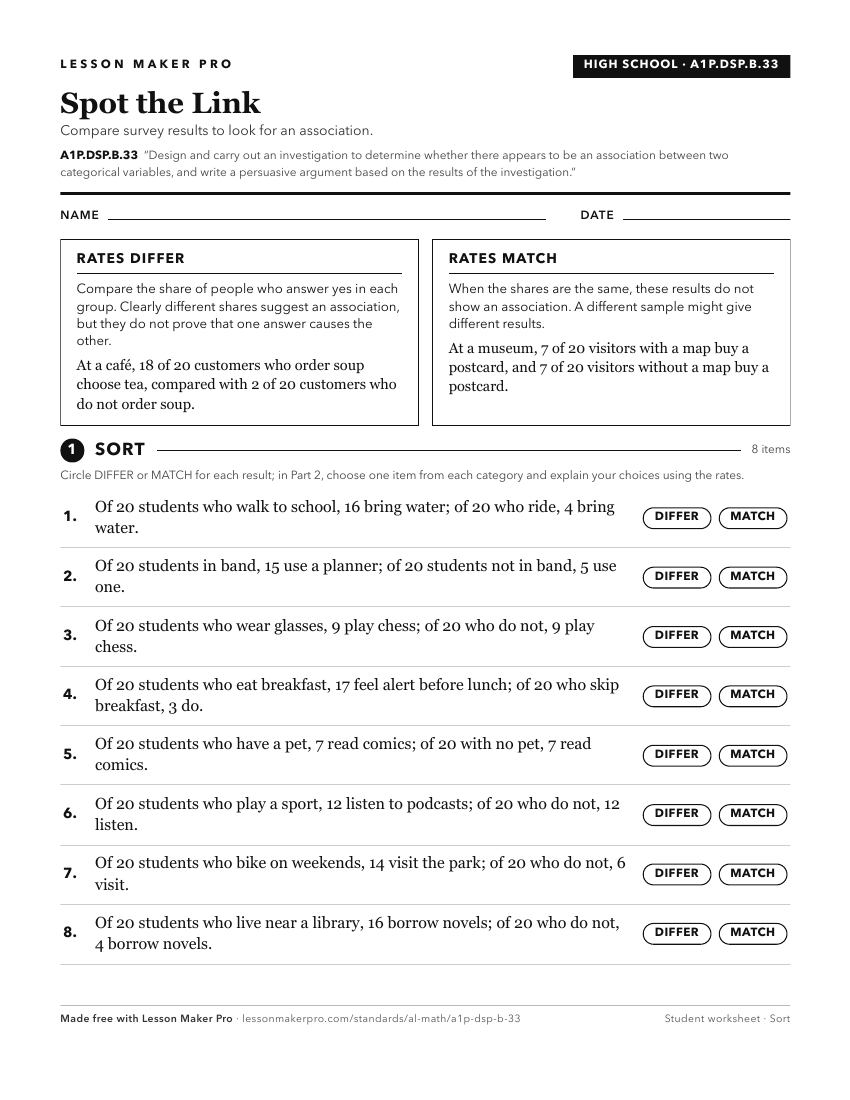
A ready-to-print activity worksheet aligned to A1P.DSP.B.33, with an answer key for the teacher on its own page. No account needed.
PDF, US Letter, prints cleanly in black and white.
Download the worksheetKeep exploring
Related Standards
- 8A.DSP.F.42
Design and carry out an investigation to determine whether there appears to be an association between two categorical variables, and write a persuasive argument...
- A1P.DSP.D.35
Analyze the possible association between two categorical variables.
- 8A.DSP.C.39
Analyze the possible association between two categorical variables.
- A2S.DSP.B.24
Design and carry out an experiment or survey to answer a question of interest, and write an informal persuasive argument based on the results.
Turn this exact standard into a lesson
Grade, subject, topic, and the complete standard are prefilled. Create one free, no account needed.
Also for this standard:Make a WorksheetMake a QuizMake a Sub Lesson