Alabama Math 8A.AF.G.20.a
The Standard
- 8A.AF.G
- Graphs can be used to obtain exact or approximate solutions of equations, inequalities, and systems of equations and inequalities – including systems of linear equations in two variables and systems of linear and quadratic equations (given or obtained by using technology).
- 8A.AF.G.20
- Explain why the x-coordinates of the points where the graphs of the equations y = f(x) and y = g(x) intersect are the solutions of the equation f(x) = g(x).
Find the approximate solutions of an equation graphically, using tables of values, or finding successive approximations, using technology where appropriate.
2019 Alabama Course of Study: Mathematics · Graphs can be used to obtain exact or approximate solutions of equations, inequalities, and systems of equations and inequalities – including systems of linear equations in two variables and systems of linear and quadratic equations (given or obtained by using technology).
Teacher's field guide
What This Standard Means
What Students Need to Do
- Students graph both sides of an equation and estimate where they meet. They use a table or calculator to narrow each solution to a requested place value.
What Mastery Looks Like
- For x² = 2, a student finds both solutions, about -1.41 and 1.41. They check nearby values and say the answers are estimates.
Common Misconceptions
- Students may report the y-value where graphs meet instead of the x-value. They may miss a negative solution or treat a rounded graph reading as exact.
How to Assess It
- Exit ticket: Use a calculator table to estimate both solutions to x² = 3 to the nearest tenth. Show how you narrowed each answer.
Lesson moves
Ways to Teach It
Make a table for x² from -2 to 2 in steps of 0.5, plot the points on graph paper, and mark where y = 2 crosses.
Ask: Why does a table with only positive x-values show just one solution to x² = 2?
Give pairs a calculator and x² = 5; have them bracket both solutions between consecutive tenths, then check by squaring.
Draw a square with area 10 square centimeters, then use a calculator table to estimate its side length to the nearest tenth.
Free download
Printable 8A.AF.G.20.a Worksheet
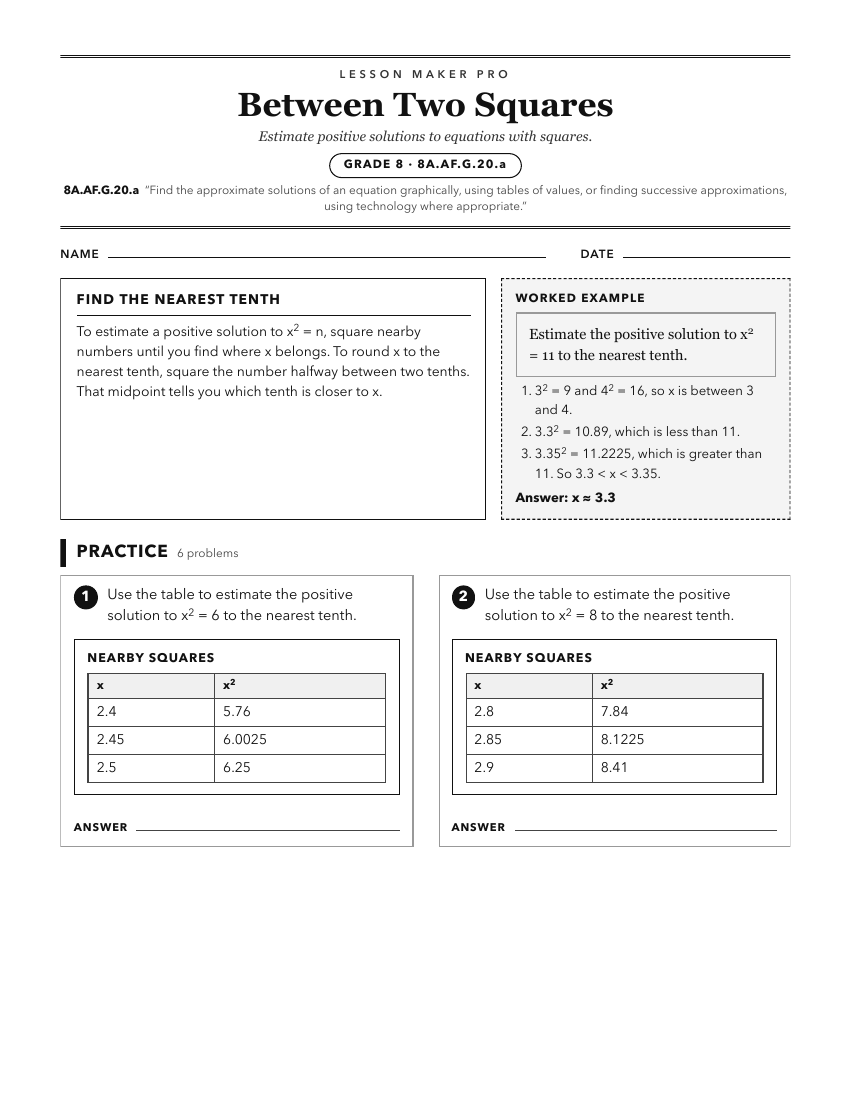
A ready-to-print activity worksheet aligned to 8A.AF.G.20.a, with an answer key for the teacher on its own page. No account needed.
PDF, US Letter, prints cleanly in black and white.
Download the worksheetKeep exploring
Related Standards
- 7A.AF.D.25
Find approximate solutions by graphing the functions, making tables of values, or finding successive approximations, using technology where appropriate.
- A1P.AF.F.19.a
Find the approximate solutions of an equation graphically, using tables of values, or finding successive approximations, using technology where appropriate. Not...
- A2S.AF.E.14.a
Find the approximate solutions of an equation graphically, using tables of values, or finding successive approximations, using technology where appropriate. Ext...
- A1P.AF.F.18
Solve systems consisting of linear and/or quadratic equations in two variables graphically, using technology where appropriate.
Turn this exact standard into a lesson
Grade, subject, topic, and the complete standard are prefilled. Create one free, no account needed.
Also for this standard:Make a WorksheetMake a QuizMake a Sub Lesson