Alabama Math 8A.AF.D.12.b
The Standard
- 8A.AF.D
- The structure of an equation or inequality (including, but not limited to, one-variable linear and quadratic equations, inequalities, and systems of linear equations in two variables) can be purposefully analyzed (with and without technology) to determine an efficient strategy to find a solution, if one exists, and then to justify the solution.
- 8A.AF.D.12
- Select an appropriate method to solve a system of two linear equations in two variables.
Contrast solutions to a system of two linear equations in two variables produced by algebraic methods with graphical and tabular methods.
2019 Alabama Course of Study: Mathematics · The structure of an equation or inequality (including, but not limited to, one-variable linear and quadratic equations, inequalities, and systems of linear equations in two variables) can be purposefully analyzed (with and without technology) to determine an efficient strategy to find a solution, if one exists, and then to justify the solution.
Teacher's field guide
What This Standard Means
What Students Need to Do
- Students solve two linear equations and find where their lines meet. They compare the exact answer from algebra with what a graph and a table show.
What Mastery Looks Like
- A student finds (5/3, 10/3) for y = 2x and x + y = 5. They explain why a graph gives an estimate and a table with only whole-number x-values misses the intersection.
Common Misconceptions
- Students may treat a point that looks close on a graph as an exact answer. They may think a system has no solution when a table has no matching row.
How to Assess It
- Exit ticket: Solve y = 2x and x + y = 5 algebraically. Explain what you would see on a graph and in a table that lists only whole-number x-values.
Lesson moves
Ways to Teach It
Use graph paper and rulers to plot y = 2x and x + y = 5; mark the crossing, then check its coordinates with substitution.
Ask, “Why might a table using only whole-number x-values miss where y = 2x and x + y = 5 meet?”
Match graph, table, and algebra cards for y = x + 1 with y = -x + 5, then repeat with y = x + 1 and y = x - 2.
Graph taxi fares of $4 plus $2 per mile and $1 plus $4 per mile; compare the break-even point with a whole-mile table.
Free download
Printable 8A.AF.D.12.b Worksheet
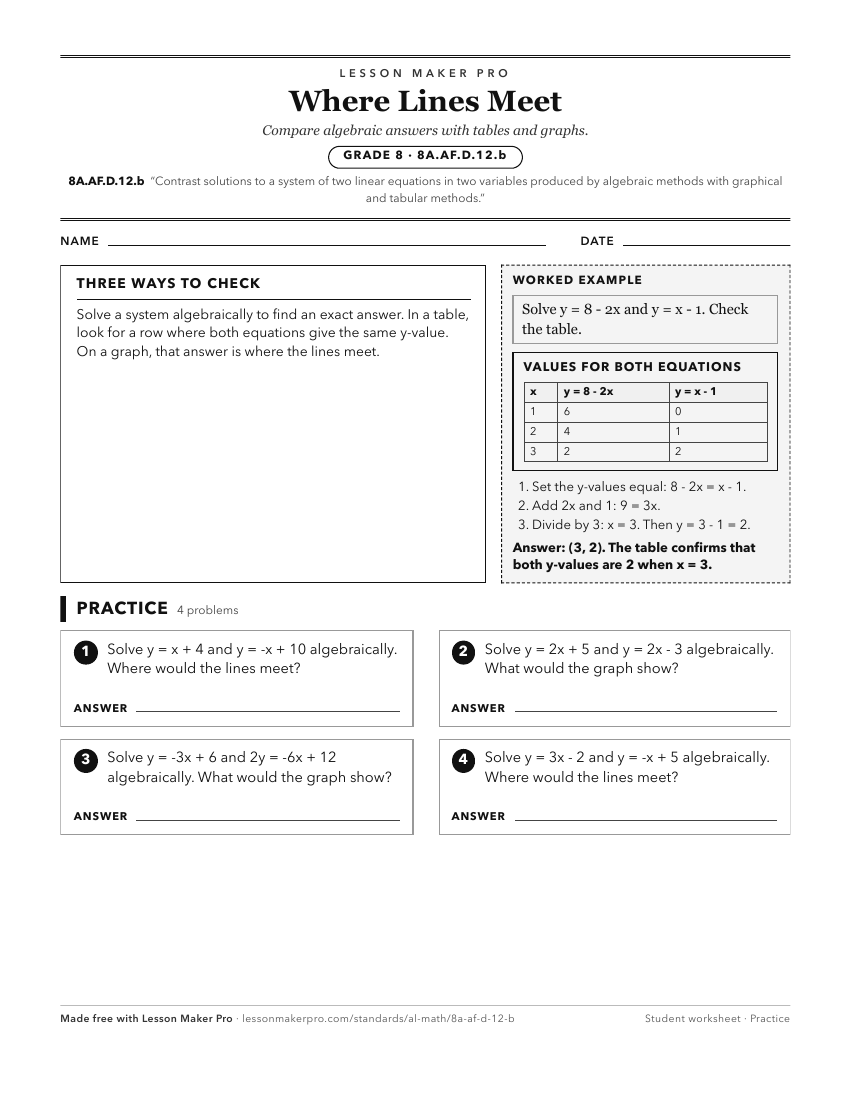
A ready-to-print activity worksheet aligned to 8A.AF.D.12.b, with an answer key for the teacher on its own page. No account needed.
PDF, US Letter, prints cleanly in black and white.
Download the worksheetKeep exploring
Related Standards
- A1P.AF.C.10.b
Contrast solutions to a system of two linear equations in two variables produced by algebraic methods with graphical and tabular methods.
- 8.AF.C.12
Solve systems of two linear equations in two variables by graphing and substitution.
- 8A.AF.B.9
Solve systems of two linear equations in two variables by graphing and substitution.
- 8A.AF.D.12.a
Solve a system of two equations in two variables by using linear combinations; contrast situations in which use of linear combinations is more efficient with th...
Turn this exact standard into a lesson
Grade, subject, topic, and the complete standard are prefilled. Create one free, no account needed.
Also for this standard:Make a WorksheetMake a QuizMake a Sub Lesson