Alabama Math 7A.PR.B.6.c
The Standard
- 7A.PR.B
- Analyze the relationship between proportional and non-proportional situations.
- 7A.PR.B.6
- Interpret y = mx + b as defining a linear equation whose graph is a line with m as the slope and b as the y-intercept.
Graph linear relationships, interpreting the slope as the rate of change of the graph and the y-intercept as the initial value.
2019 Alabama Course of Study: Mathematics · Analyze the relationship between proportional and non-proportional situations.
Teacher's field guide
What This Standard Means
What Students Need to Do
- Students graph a linear relationship from a table or equation. They read the slope as the change in y for each one-unit increase in x, and the y-intercept as the value when x is zero. They check whether the line passes through (0, 0) to decide if the relationship is proportional.
What Mastery Looks Like
- Given a table of taxi fares, a student plots the points and labels the starting fare and cost per mile. They find the rate from two points and explain why a nonzero starting fare makes the relationship nonproportional.
Common Misconceptions
- Students may confuse the y-intercept with where the line crosses the x-axis. They may count grid squares without checking the scale on each axis, or assume every straight line shows a proportional relationship.
How to Assess It
- Exit ticket: A bike rental costs $4 to start and $3 per hour. Graph the cost for 0 through 3 hours, label the slope and y-intercept with units, and say whether the relationship is proportional.
Lesson moves
Ways to Teach It
On graph paper, plot rental costs of $4, $7, $10, and $13 for hours 0 through 3; mark the starting cost.
Ask pairs: Why is a line that starts at $4 not proportional when it rises $3 each hour?
Play slope-and-start match: students match four line graphs to cards showing hourly rates and starting costs, then explain one match.
Give students a taxi rate card with a $5 pickup fee and $2 per mile; graph fares for 0 to 4 miles.
Free download
Printable 7A.PR.B.6.c Worksheet
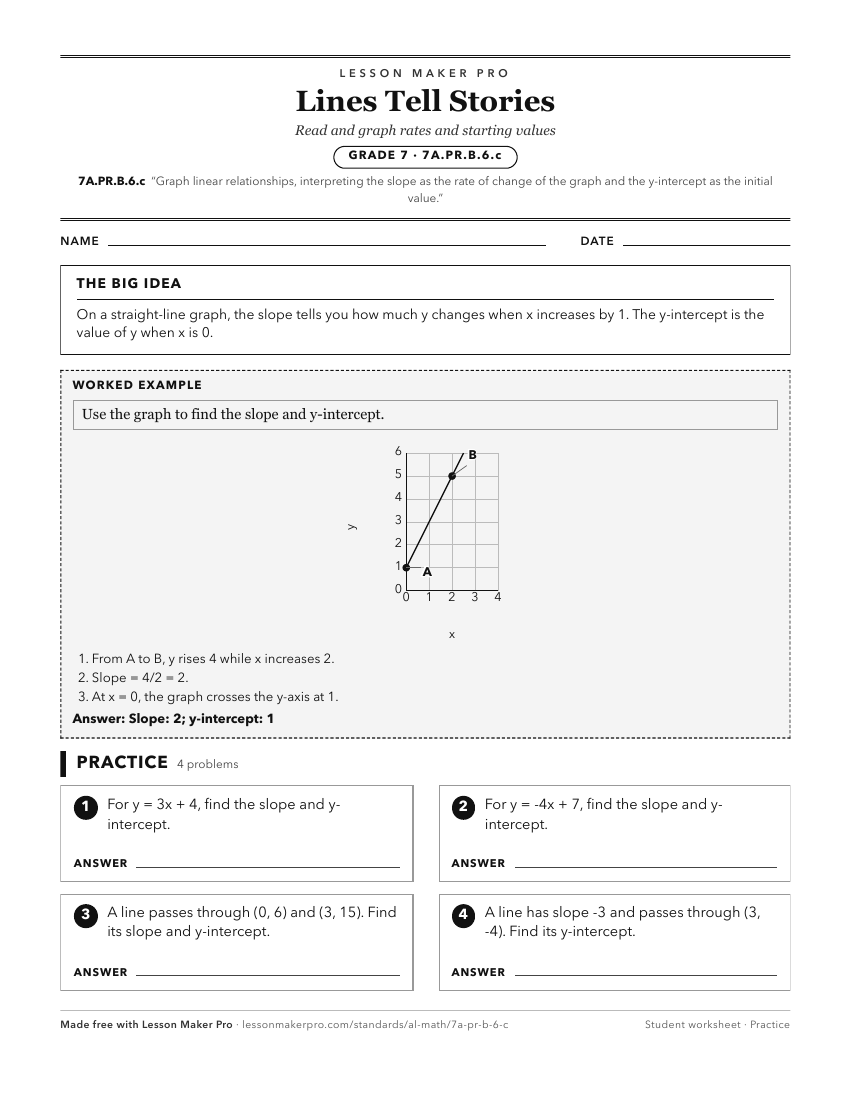
A ready-to-print activity worksheet aligned to 7A.PR.B.6.c, with an answer key for the teacher on its own page. No account needed.
PDF, US Letter, prints cleanly in black and white.
Download the worksheetKeep exploring
Related Standards
- 8.AF.B.9.c
Graph linear relationships, interpreting the slope as the rate of change of the graph and the y-intercept as the initial value.
- 8.AF.E.16.a
Interpret the rate of change (slope) and initial value of the linear function from a description of a relationship or from two points in a table or graph.
- 7A.AF.D.23.a
Interpret the rate of change (slope) and initial value of the linear function from a description of a relationship from two points in a table or graph.
Turn this exact standard into a lesson
Grade, subject, topic, and the complete standard are prefilled. Create one free, no account needed.
Also for this standard:Make a WorksheetMake a QuizMake a Sub Lesson