Virginia SOL 7.PS.1.c
The Standard
Describe changes in the experimental probability as the number of trials increases.
Virginia Standards of Learning for Mathematics · The student will use statistical investigation to determine the probability of an event and investigate and describe the difference between the experimental and theoretical probability.
Teacher's field guide
What This Standard Means
What Students Need to Do
- Students conduct or examine a chance experiment across several trial counts. They track the cumulative relative frequency and explain why results usually become more stable with more data.
What Mastery Looks Like
- Students can calculate and compare cumulative proportions at different trial counts. They explain that larger samples usually produce more stable results, though exact agreement is not guaranteed.
Common Misconceptions
- Students may expect the results to match the expected probability exactly. They may also think the proportion must move closer after every trial, rather than fluctuating along the way.
How to Assess It
- Give students these coin results: 7 heads in 10 tosses, 28 in 50, and 104 in 200. Ask them to describe how the experimental probability changes and explain why.
Lesson moves
Ways to Teach It
Pairs toss a coin 100 times, record cumulative heads at 10, 25, 50, and 100 trials, then graph the proportions.
Ask, “Why can 7 heads in 10 tosses be reasonable, while 70 heads in 100 tosses would be more surprising?”
Use a digital spinner in rounds of 10 trials; teams predict which team’s cumulative proportion will be closest after each round.
Show free throw results after 5, 20, and 100 shots, then have students choose which percentage best estimates future performance.
Free download
Printable 7.PS.1.c Worksheet
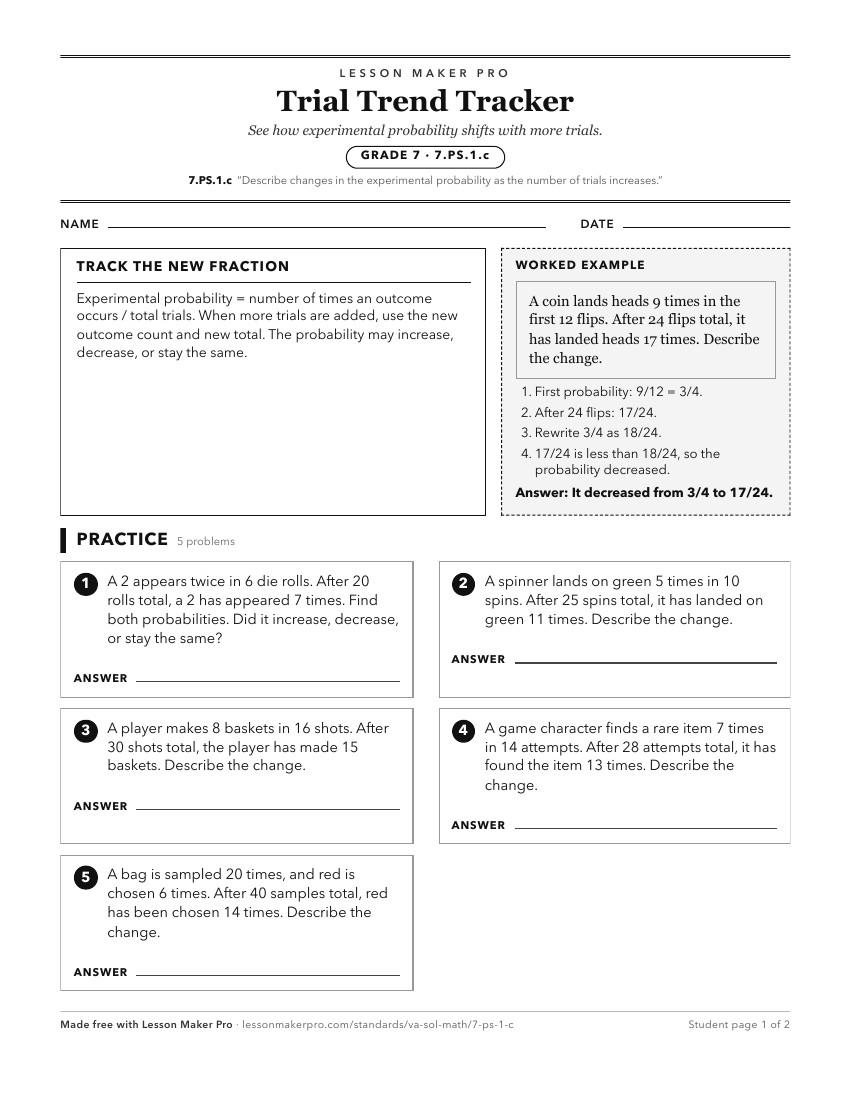
A ready-to-print activity worksheet aligned to 7.PS.1.c, with an answer key for the teacher on its own page. No account needed.
PDF, US Letter, prints cleanly in black and white.
Download the worksheetKeep exploring
Related Standards
- 7.PS.1.b
Given the results of a statistical investigation, determine the experimental probability of an event.
- 7.PS.1.d
Investigate and describe the difference between the probability of an event found through experiment or simulation versus the theoretical probability of that sa...
- 7.PS.1
The student will use statistical investigation to determine the probability of an event and investigate and describe the difference between the experimental and...
- 7.PS.1.a
Determine the theoretical probability of an event.
Turn this exact standard into a lesson
Grade, subject, topic, and the complete standard are prefilled. Create one free, no account needed.
Also for this standard:Make a WorksheetMake a QuizMake a Sub Lesson