NGSS HS-LS3-3
The Standard
Apply concepts of statistics and probability to explain the variation and distribution of expressed traits in a population.
Next Generation Science Standards
Teacher's field guide
What This Standard Means
What Students Need to Do
- Students use data, graphs, percentages, and probability to describe how an expressed trait varies across a population. They connect patterns in the data to genetic and environmental influences.
What Mastery Looks Like
- Students can build or interpret a histogram, calculate trait frequencies, and compare the center and spread of two groups. They explain why probability describes a population pattern, not a certain outcome for one individual.
Common Misconceptions
- Students often think dominant traits are always common and recessive traits are always rare. They may treat genes as the only cause of a trait, or assume a probability guarantees one individual’s outcome.
How to Assess It
- Exit ticket: Of 20 AA plants, 14 flowered when warm and 8 when cool. Of 20 aa plants, 6 flowered when warm and 2 when cool. Calculate each percentage and explain the evidence for genetic and environmental effects.
Lesson moves
Ways to Teach It
Measure leaf lengths from two plant varieties grown in sun and shade, then make histograms and compare centers and spreads.
Ask students to write: Why can people with similar genotypes show different heights, and what data would support your explanation?
Run a trait-data card sort where teams match population graphs to claims about genetic influence, environmental influence, or both.
Compare crop yields for two varieties grown with different water levels, then explain how genes and environment may shape the results.
Free download
Printable HS-LS3-3 Worksheet
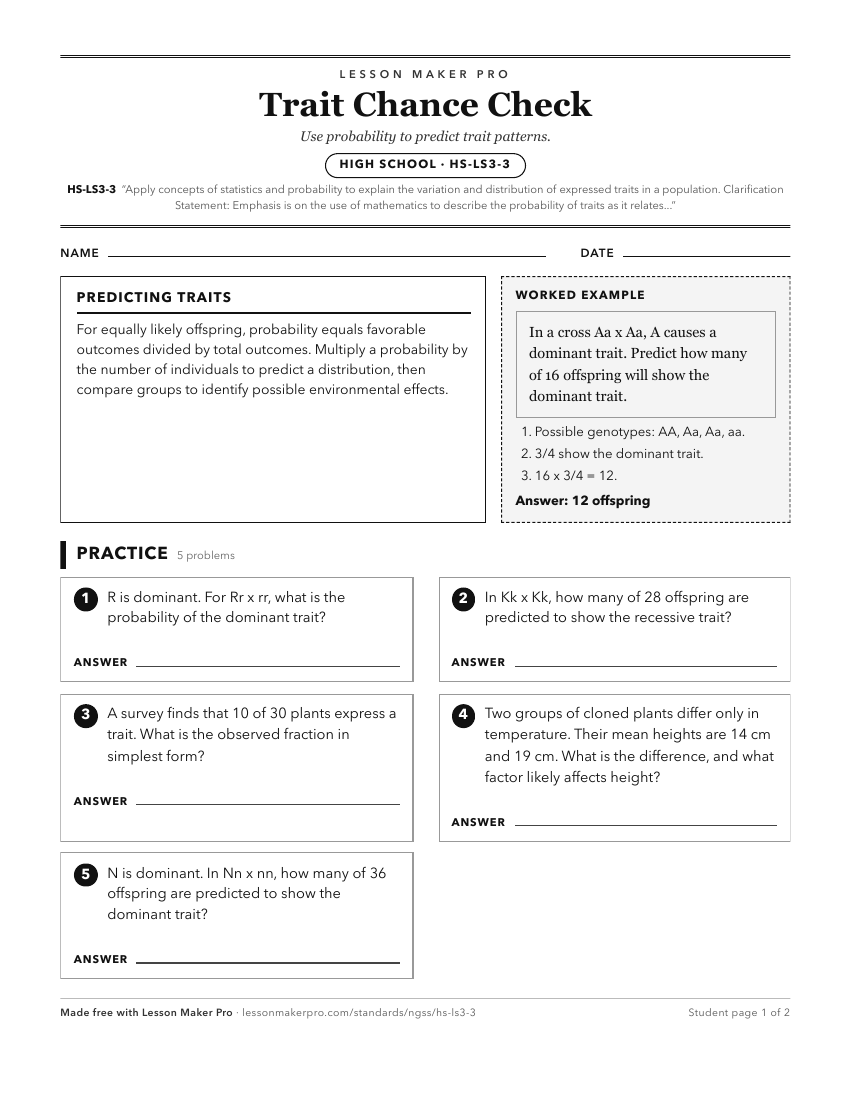
A ready-to-print activity worksheet aligned to HS-LS3-3, with an answer key for the teacher on its own page. No account needed.
PDF, US Letter, prints cleanly in black and white.
Download the worksheetBefore This Standard
If students are struggling here, check these first.
- MS-LS3-2
Understanding how reproduction creates genetic variation helps students explain why expressed traits vary and are distributed across populations.
- MS-LS3-1
Understanding mutations as sources of harmful, beneficial, or neutral trait changes supports explaining population trait variation and distributions.
Keep exploring
Related Standards
- MS-LS4-4
Construct an explanation based on evidence that describes how genetic variations of traits in a population increase some individuals' probability of surviving a...
- 3-LS3-1
Analyze and interpret data to provide evidence that plants and animals have traits inherited from parents and that variation of these traits exists in a group o...
- HS-LS4-3
Apply concepts of statistics and probability to support explanations that organisms with an advantageous heritable trait tend to increase in proportion to organ...
- MS-LS4-6
Use mathematical representations to support explanations of how natural selection may lead to increases and decreases of specific traits in populations over tim...
Turn this exact standard into a lesson
Grade, subject, topic, and the complete standard are prefilled. Create one free, no account needed.
Also for this standard:Make a WorksheetMake a QuizMake a Sub Lesson