NGSS 5-ESS2-2
The Standard
Describe and graph the amounts and percentages of water and fresh water in various reservoirs to provide evidence about the distribution of water on Earth.
Next Generation Science Standards
Teacher's field guide
What This Standard Means
What Students Need to Do
- Students compare how Earth’s water is divided among oceans, ice, groundwater, lakes, and rivers. They turn reservoir data into labeled graphs. They use the graphs to support conclusions about where fresh water is stored.
What Mastery Looks Like
- A student creates an accurate graph with a clear title, labels, scale, and units. The student explains that oceans hold nearly all water, while most fresh water is frozen or underground. The explanation cites numbers from the graph.
Common Misconceptions
- Students may think most of Earth’s water is usable fresh water because lakes and rivers are easy to see. They often confuse percentages of all water with percentages of fresh water. Small graph bars may also be mistaken for zero.
How to Assess It
- Give students this 1,000-cup model: oceans 970, ice 20, groundwater 9, lakes and rivers 1. Ask them to graph the percentages and write one evidence-based conclusion.
Lesson moves
Ways to Teach It
Have groups divide 1,000 milliliters of colored water among labeled containers using a simplified reservoir data table.
Ask students to write: Why can Earth have abundant water but limited fresh water available for people?
Give pairs reservoir, amount, percentage, and graph cards to match, then have them explain each set.
Read a local water utility source map and identify whether community water comes from rivers, lakes, or groundwater.
Free download
Printable 5-ESS2-2 Worksheet
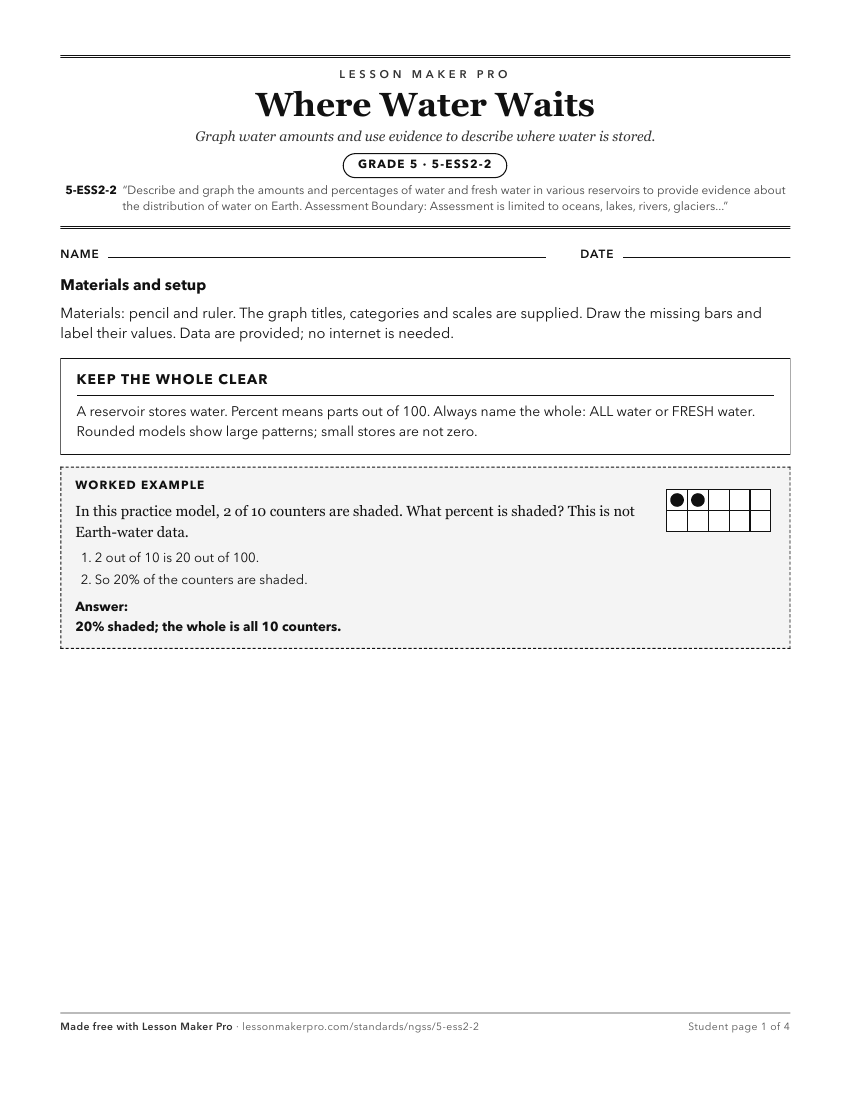
A ready-to-print activity worksheet aligned to 5-ESS2-2, with an answer key for the teacher on its own page. No account needed.
PDF, US Letter, prints cleanly in black and white.
Download the worksheetLearning progression
Where This Standard Sits
See the whole path on the Earth & Space Science progression map.
What This Unlocks
Mastery here sets students up for these next.
Keep exploring
Related Standards
- MS-LS2-1
Analyze and interpret data to provide evidence for the effects of resource availability on organisms and populations of organisms in an ecosystem.
- HS-ESS2-5
Plan and conduct an investigation of the properties of water and its effects on Earth materials and surface processes.
- MS-ESS3-1
Construct a scientific explanation based on evidence for how the uneven distributions of Earth's mineral, energy, and groundwater resources are the result of pa...
- 2-ESS2-3
Obtain information to identify where water is found on Earth and that it can be solid or liquid.
Turn this exact standard into a lesson
Grade, subject, topic, and the complete standard are prefilled. Create one free, no account needed.
Also for this standard:Make a WorksheetMake a QuizMake a Sub Lesson