CCSS.
The Standard
Reporting the number of observations.
Common Core State Standards for Mathematics
Teacher's field guide
What This Standard Means
What Students Need to Do
- Students find how many data values are included in a distribution. They count individual points or add frequencies, then report the sample size.
What Mastery Looks Like
- Students correctly count data values in a list or dot plot and add frequencies in a table or histogram. They state the sample size in context.
Common Misconceptions
- Students may count distinct values, bars, or categories instead of all data points. They may also add the data values rather than add their frequencies.
How to Assess It
- Give a frequency table with frequencies 2, 4, 3, and 1. Ask, “How many data values are represented, and how do you know?”
Lesson moves
Ways to Teach It
Give pairs 18 numbered data cards to sort, tally, and count before writing the sample size on a sticky note.
Display a dot plot and ask, “Why is the sample size not the number of different values?”
Play a frequency-table relay where teams add frequencies and match each table to the correct sample-size card.
Survey classmates about nightly sleep, make a frequency table, and report how many students contributed data.
Free download
Printable 6.SP.B.5a Worksheet
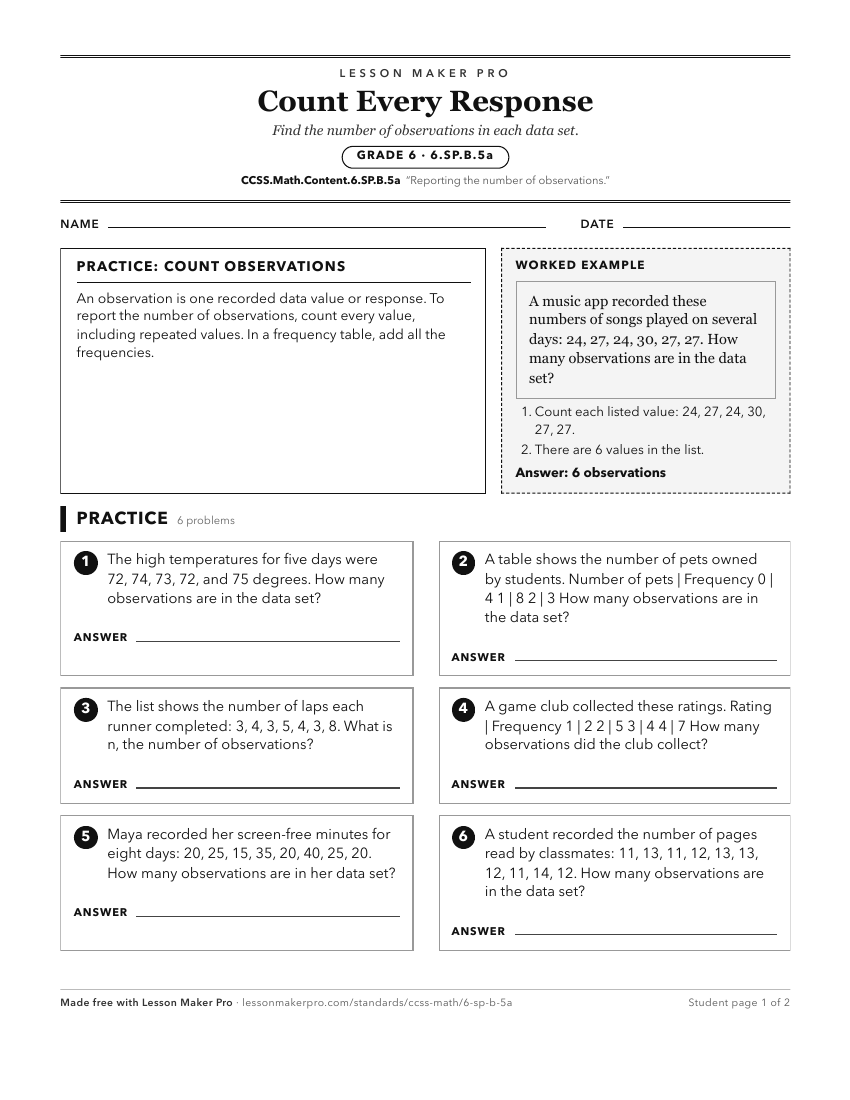
A ready-to-print activity worksheet aligned to CCSS.Math.Content.6.SP.B.5a, with an answer key for the teacher on its own page. No account needed.
PDF, US Letter, prints cleanly in black and white.
Download the worksheetKeep exploring
Related Standards
- CCSS.Math.Content.K.CC.B
Count to tell the number of objects.
- CCSS.Math.Content.K.CC.C
Compare numbers.
- CCSS.Math.Content.6.SP.B.4
Display numerical data in plots on a number line, including dot plots, histograms, and box plots.
- CCSS.Math.Content.K.MD.B
Classify objects and count the number of objects in each category.
Turn this exact standard into a lesson
Grade, subject, topic, and the complete standard are prefilled. Create one free, no account needed.
Also for this standard:Make a WorksheetMake a QuizMake a Sub Lesson